
Fig. 3.
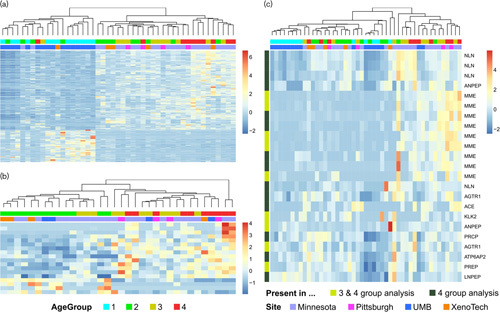
(a) Heatmap of transcripts from genome-wide analysis with a P value less than 0.0001 from four age group analysis; (b) Heatmap of transcripts from genome-wide analysis with a P value less than 0.0001 from three age group analysis (c) Heatmap of transcripts from the renin–angiotensin system pathway with a P value less than 0.05 from four age group analysis and/or three group analysis.