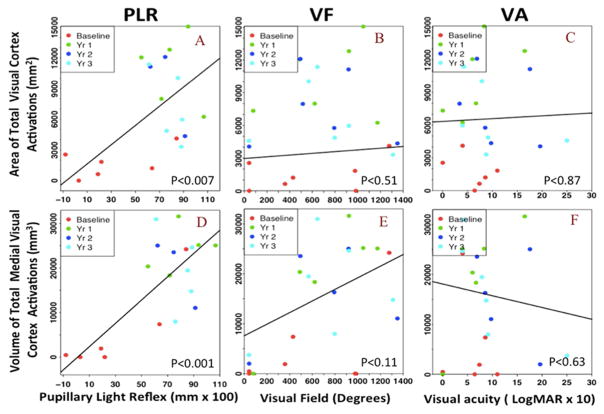
Figure 4. Association between PLR, VF and VA clinical measures and visual cortical activations.
Scatter plot with linear regression lines from the mixed effect model for the association of cortical activations with the PLR, VF and VA measures. The top portion shows the association of the PLR (A), VF (B), and VA (C) measures with the area of the total visual cortex activations. The bottom portion shows the association between the PLR (D), VF (E), and VA (F) measures with the volume of the total medial visual cortex activations. Both measures of the cortical activations are significantly associated with PLR of the RPE65 patients over time. However, the medial activations are more strongly associated with the VF over time. No association was observed with the VA for either the area of the total visual cortex and the volume of the medial activations.

