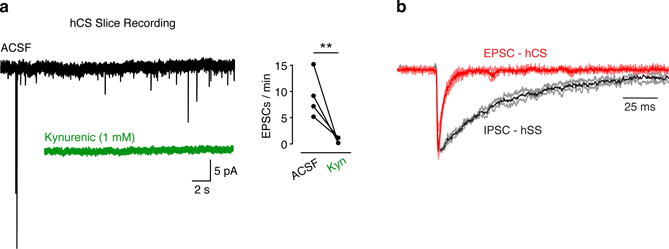
Extended Data Figure 4. Electrophysiological recordings of hCS and hSS.

(a) Representative EPSC traces of recordings from hCS neurons (sliced preparation) before (black) and during (green) exposure to the glutamate receptor blocker kynurenic acid (1 mM) (Mann-Whitney U-test, **P= 0.007). (b) Overlap of averaged EPSCs (red) recorded in hCS neurons (n= 6 cells) and averaged IPSCs (black) recorded in hSS (n= 5 cells). Data are mean ± s.d.
