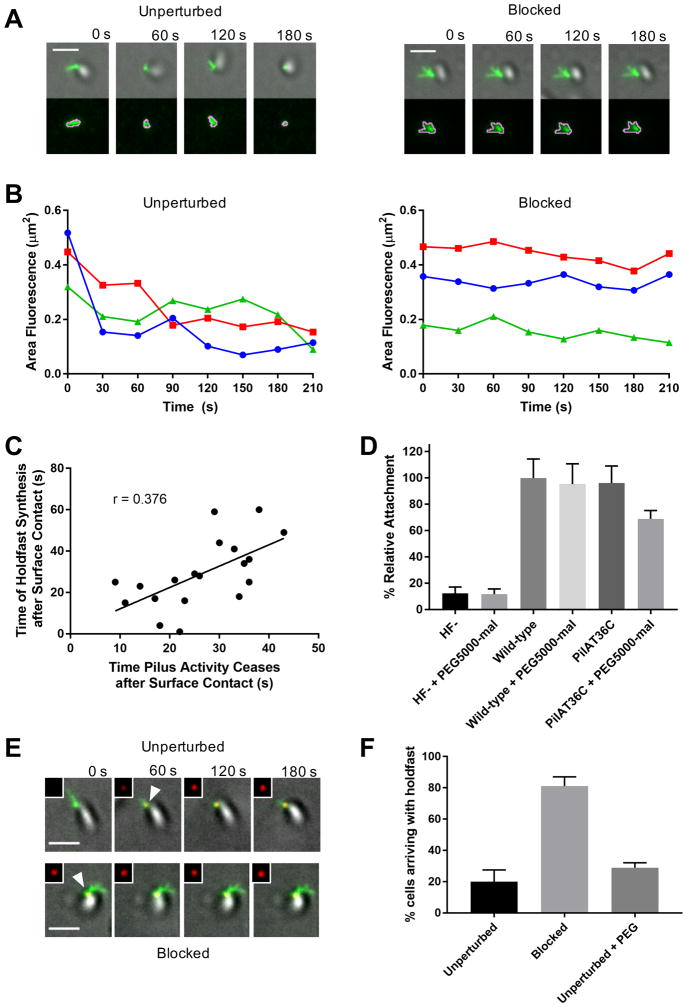
Figure 4. Resistance to C. crescentus tad pilus retraction triggers surface stimulation of holdfast synthesis.
(A) Representative TIRF images of unperturbed cell labeled with AF488-mal exhibiting dynamic pilus activity and blocked cell labeled with both AF488-mal and PEG5000-mal exhibiting no dynamic pilus activity with overlays of gray cell body and green fluorescent pili. The bottom image panel shows green fluorescent pili surrounded by pink MicrobeJ overlay used to measure changes in fluorescence area of pili (μm2) over time shown in graphs (B). (B) Graphs showing changes in fluorescence area occupied by pili over time by cells shown in (A). (C) Plot showing correlation between the time of holdfast synthesis after surface contact and the time of cessation of dynamic pilus activity after surface contact for 19 cells. (D) Relative attachment assay showing binding efficiency of holdfast minus (HF-) and PilAT36C strains compared to wild-type after 30 min binding ± PEG5000-mal. Data are representative of binding from 3 independent cultures normalized to wild-type binding levels. Error bars show mean ± SD. PilAT36C + PEG-mal is significantly different from all other treatments based on unpaired, two-tailed T-test (P < 0.03). (E) Representative TIRF microscopy images of cells unperturbed or blocked for pilus retraction upon surface contact in the presence of AF594-WGA where time = 0 s is time of surface contact. The cell body is gray, labeled pili are green, and HF are red, and shown in upper right inset of each image. White arrowheads represent first appearance of holdfast for cell depicted. Scale bars are 2 μm. (F) Quantification of cells after labeling with AF488-mal (unperturbed); AF488-mal + PEG5000-mal (blocked); or AF488-mal + PEG5000 (unperturbed + PEG). A minimum of 30 cells from each of 3 independent biological replicates was quantified. Error bars show mean ± SD. Scale bars are 2 μm.

