
Extended Data Figure 2. Expression of Semaphorin receptors in geniculate ganglion neurons.
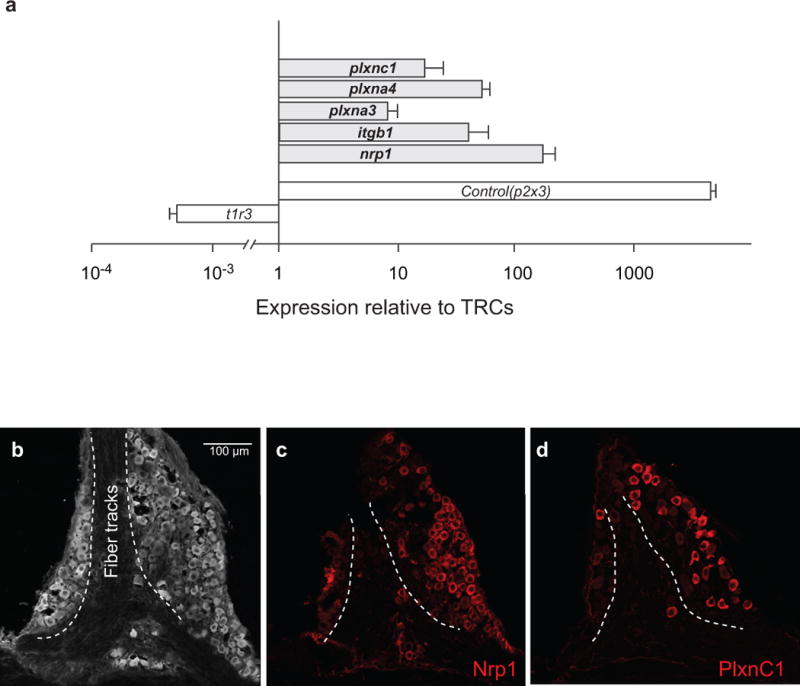
a, Quantitative RT-PCR analysis showing expression of candidate Sema3A receptors5,6 (Nrp1, PlxnA3, and PlxnA4) and Sema7A receptors5,6 (Itgb1 and PlxnC1) in the geniculate ganglia. P2x3 and T1r3 were used as controls for geniculate ganglia35 and TRC9 tissue integrity, respectively. Nrp1, Neuropilin 1; PlxnA3, Plexin A3; PlxnA4, Plexin A4; Itgb1, Integrin β1; PlxnC1, Plexin C1. Data are presented for each gene as its relative abundance in the ganglia compared with TRCs. Values are mean + s.e.m. (n = 3). b-d, Confocal microscopy images of immunostains illustrating the expression of Nrp1 (c) and PlxnC1 (d) in subsets of geniculate ganglion neurons. Panel b depicts the anatomy of the ganglion highlighting the location of fiber tracks.