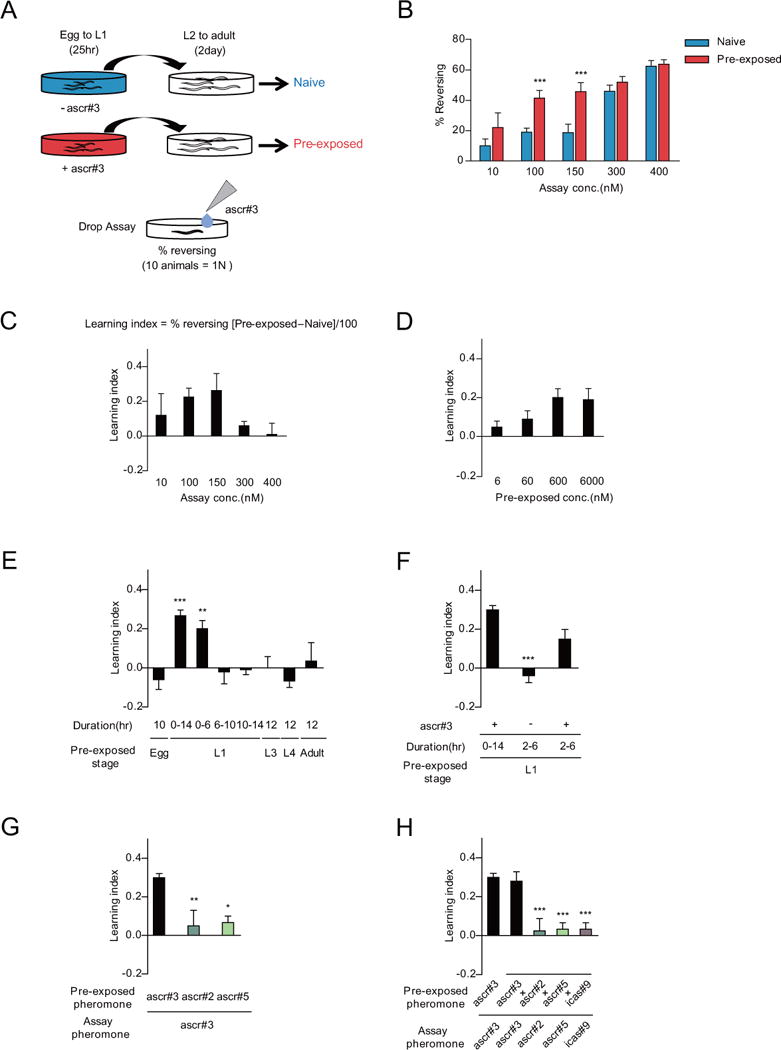
Figure 1. Transient exposure to the ascr#3 pheromone after birth specifically enhances ascr#3 avoidance behavior of adults.

A. Experimental scheme of pheromone imprinting assay. The animals are exposed to dH2O (naive: shown in blue) and ascr#3 diluted with dH2O (pre-exposed: shown in red) from egg to the L1 stage. The percentage of reversal is calculated by measuring avoidance frequencies to ascr#3 exposure at the adult stage.
B and C. Percentage of reversal (B) and learning index (C) of naive and pre-exposed adult animals to 10 nM, 100 nM, 150 nM, 300 nM, and 400 nM ascr#3. Learning index is calculated by the percentage of the reversal rate of pre-exposed minus the reversal rate of naive divided by 100. *** indicates different ascr#3 avoidance from naive at p<0.001 by one-way ANOVA with Bonferroni’s post hoc test. n=50–200 each.
D. Learning index of adult animals pre-exposed to 6 nM, 60 nM, 600 nM and 6000 nM ascr#3 at L1. n=80–200 each.
E. Learning index of adult animals pre-exposed to 600 nM ascr#3 at different developmental stages. Exposure times during the specific developmental stage are indicated as egg (10 hours), L3 (12 hours), L4 (12 hours) and adult (12 hours). For the L1 stage, exposure times are indicated as between starting and ending time of pheromone exposure. ** and *** indicate different from egg (10 hours) at p<0.01 and p<0.001 by one-way ANOVA with Dunnett’s post hoc test, respectively. n=30–190 each.
F. Learning index of adult animals exposed to ascr#3 for 4 hours in the L1 stage. Pre-exposure for 2~6 hour in the L1 stage is sufficient for ascr#3 imprinting. *** indicates different from ascr#3 pre-exposure for 14 hours at p<0.001 by one-way ANOVA with Dunnett’s post hoc test. n=80–120 each.
G and H. Learning index of adult animals pre-exposed and/or assayed with other pheromone components. Animals are pre-exposed to either 600 nM ascr#3, ascr#2 or ascr#5 and assayed with 100 nM ascr#3 (G) and pre-exposed to pheromone mixture containing 600 nM ascr#3, ascr#2, ascr#5 and icas#9, and assayed with 100 nM ascr#3, ascr#2, ascr#5 or icas#9 (H). *, ** and *** indicate different from the control (ascr#3 pre-exposed and ascr#3 assayed) at p<0.05, p<0.01 and p<0.001, respectively, by one-way ANOVA with Dunnett’s post hoc test. (G) n=30–100 each. (H) n=30–50 each. (B–H) Error bars represent SEM.
See also Figure S1.
