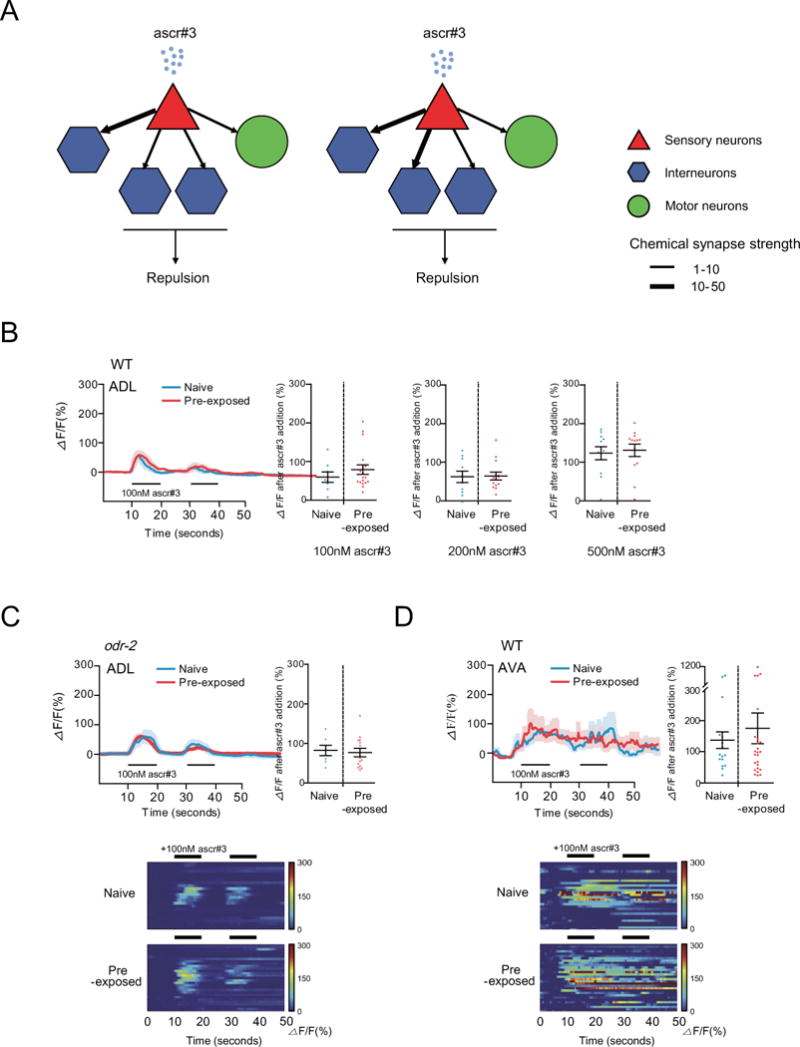
Figure 3. Ca2+ response to acute ascr#3 exposure is not altered in the ascr#3-sensing ADL neurons and their downstream command interneurons of ascr#3 imprinted animals.

A. Post-synaptic connections of the ADLL and ADLR neurons. The AIB, AVD, AVA and SMBV neurons are post-synaptic to ADL. Chemical synapses between sensory (triangles), inter-(hexagons) and motor (circles) are indicated as arrows. Synaptic strength is indicated in thickness of lines (www.wormwiring.org).
B. Ca2+ transients of ADL in response to 100 nM ascr#3 exposure. The average traces of Ca2+ responses during two pulses of 100 nM ascr#3 (left) and the maximum value of Ca2+ responses to 100 nM, 200 nM or 500 nM ascr#3 (right) of naive (shown in blue) or pre-exposed animals (shown in red) in 50 seconds are shown. n=8 (naive) and 18 (pre-exposed) each.
C. Ca2+ transients of ADL in response to 100 nM ascr#3 exposure in odr-2 mutants. The average traces of Ca2+ responses during two pulses of 100 nM ascr#3 (left), heat map of individual Ca2+ responses to ascr#3 (bottom), and the maximum value of Ca2+ responses to 100 nM ascr#3 (right) in naive (shown in blue) or pre-exposed (shown red) odr-2 mutants are shown. n=7 (naive) and 14 (pre-exposed) each.
D. Ca2+ transients of AVA in response to 100 nM ascr#3 exposure. The average traces of Ca2+ responses during two pulses of 100 nM ascr#3 (left), heat map of individual Ca2+ responses to ascr#3 (bottom), and the maximum value of Ca2+ responses to 100 nM ascr#3 (right) in naive (shown in blue) or pre-exposed animals (shown in red) are shown. n=7 (naive) and 8 (pre-exposed) each. All error bars represent SEM.
See also Figure S3.
