
Figure 9.
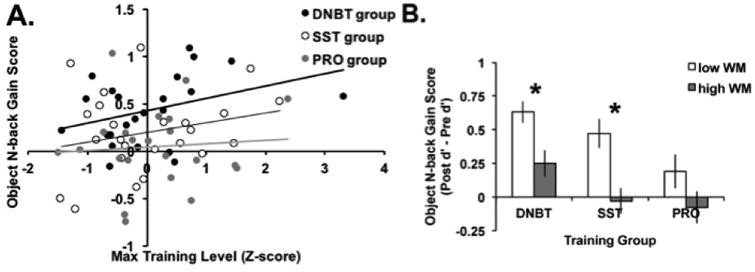
Predictors of near transfer to the object n-back task. A) Scatterplot for each training group illustrating the relationship between standardized maximum training level reached and improvement on the object n-back task. B) Baseline performance on the object n-back task was associated with greater gains after training on that same task for the WM groups but not the PRO group. Error bars represent standard error of the mean. *p<0.05.