Abstract
This work develops a material reconstruction method for spectral CT, namely Total Image Constrained Material Reconstruction (TICMR), to maximize the utility of projection data in terms of both spectral information and high signal-to-noise ratio (SNR). This is motivated by the following fact: when viewed as a spectrally-integrated measurement, the projection data can be used to reconstruct a total image without spectral information, which however has a relatively high SNR; when viewed as a spectrally-resolved measurement, the projection data can be utilized to reconstruct the material composition, which however has a relatively low SNR. The material reconstruction synergizes material decomposition and image reconstruction, i.e., the direct reconstruction of material compositions instead of a two-step procedure that first reconstructs images and then decomposes images. For material reconstruction with high SNR, we propose TICMR with nonlocal total variation (NLTV) regularization. That is, first we reconstruct a total image using spectrally-integrated measurement without spectral binning, and build the NLTV weights from this image that characterize nonlocal image features; then the NLTV weights are incorporated into a NLTV-based iterative material reconstruction scheme using spectrally-binned projection data, so that these weights serve as a high-SNR reference to regularize material reconstruction. Note that the nonlocal property of NLTV is essential for material reconstruction, since material compositions may have significant local intensity variations although their structural information is often similar. In terms of solution algorithm, TICMR is formulated as an iterative reconstruction method with the NLTV regularization, in which the nonlocal divergence is utilized based on the adjoint relationship. The alternating direction method of multipliers is developed to solve this sparsity optimization problem. The proposed TICMR method was validated using both simulated and experimental data. In comparison with FBP and total-variation-based iterative method, TICMR had improved image quality, e.g., contrast-to-noise ratio and spatial resolution.
Index Terms: Image reconstruction, spectral CT, nonlocal TV
I. Introduction
With the rapid development of X-ray CT technology, CT imaging has been extensively used in medical diagnosis, radiation therapy, and industrial evaluations. Spectral CT based on energy-resolved photon-counting detector (PCD) has been recently introduced for medical imaging, such as spectral breast CT [1]–[3] and k-edge imaging [4], [5]. Conventional CT imaging scans at a fixed tube voltage and reconstructs a single image, which represents the effective x-ray attenuation coefficient of the object for the input spectrum. Spectral CT, on the other hand, exploits the energy dependence of the x-ray attenuation coefficients for different materials, and reconstructs spectral images. The traditional approach for spectral CT measures the energy-dependent information using two independent exposures at different beam energies. The application of this method is limited not only by the radiation dose from additional exposures, but also the potential mis-registration between dual-energy images. The introduction of the semiconductor-based PCD offers a new solution for spectral CT. This emerging x-ray detector technology can count individual photons and sort them according to their energies, which allows spectral information to be acquired within a single exposure. Multiple energy thresholds can be set in the application-specific integrated circuit, so that the energy specific images can be reconstructed for 2 to 6 energy bins [2], [4]. Thus, spectral CT based on PCD can sample more data points on the energy-dependent x-ray attenuation curves of different materials without additional radiation dose. In the mean time, the spectrum overlap between the multi-energy images is minimized. Moreover, images reconstructed from different energy bins are perfectly registered, as they are all acquired simultaneously. With these unique advantages, PCD-based spectral CT exhibits great potentials in material decomposition with high efficiency and accuracy [2].
Spectral CT aims to reconstruct the material compositions from the multi-energy projection data. It can be determined in a two-step procedure, i.e., image reconstruction for spectral images and then material decomposition from these spectral images to material compositions [3], [6]–[16], or alternatively material-specific sinogram decomposition and then material reconstruction [4], [17]–[19]. Various iterative reconstruction models have been developed [20], with energy-by-energy reconstruction [3], [4], [9], [11], [17]–[19] and joint reconstruction [7], [10], [15], [16], such as total variation (TV) sparsity [14], [16], HYPR algorithm [8], tight frame sparsity [3], [11], bilateral filtration [12], [13], patch-based low-rank model [15], rank-and-sparsity decomposition model [7] and its tensor version [10]. In order to fully utilize the image similarity in the spectral dimension, the joint reconstruction is a natural formulation [7], [10], [15], [16]. Although the image intensity with different energies can be significantly different, the global sparsity, such as low-rank models, is efficient to characterize the spectral similarity. With local sparsity (such as TV), cautiousness is required to handle such an intensity difference for joint spectral reconstruction [16]. Nevertheless, with the aforementioned two-step procedure where image reconstruction is independent of material decomposition, there are two major limitations: (1) it may not fully utilize the prior that material compositions share common structures; (2) given that the number of energy bins is often more than the number of materials, reconstructing a larger number of spectral images, which are subsequently decomposed into a smaller number of materials, may be unstable and can possibly deteriorate the reconstruction quality. Therefore, the reconstruction of an overdetermined set of spectral images independent of material decomposition is unnecessary.
In contrast, the material compositions can also be reconstructed in a one-step procedure, i.e., the direct material reconstruction from multi-energy projection data [7], [21]–[24]. For that purpose, the spectral image dependence of the materials is often linearly modeled, i.e., for dual-energy CT [21], [22], [24] or multi-energy CT [7], [23], during which either energy-independent density and material volume fraction can be both explicitly modeled or their product [22], [23], i.e., the material composition, needs to be reconstructed [7], [21], [24]. The explicit model of both energy-independent density and material volume fraction was introduced for beam hardening correction purpose [22] or when the number of energies is less than the number of materials [22], [23], for which additional steps may be needed, such as image segmentation and nonoverlapping material assumption [22]. Here we consider the multi-energy CT setting where the number of energies is often more than the number of materials, and therefore directly model the material composition [7], [21], [24].
In this work, we propose a material reconstruction method for spectral CT that maximizes the utility of projection data in terms of both spectral information and high signal-to-noise ratio (SNR), i.e., Total Image Constrained Material Reconstruction (TICMR). This is motivated by the following observations: when viewed as a spectrally-integrated measurement, the projection data can be used to reconstruct a total image without spectral information, which however has a relatively high SNR; when viewed as a spectrally-resolved measurement, the projection data can be used to reconstruct the material composition, which however has a relatively low SNR. The constraint via total image for improved SNR is achieved via nonlocal total variation (NLTV) regularization [25], [26]. As mentioned earlier, even if spectral images or material compositions share common structures, their intensity values may differ significantly. Therefore, the prior of spectral similarity may not be efficient to regularize locally. Instead, we use NLTV as a global sparsity method to extract image features from the total image and then use these high-SNR features to regularize the material reconstruction. That is, first we reconstruct a total image using spectrally-integrated measurement without spectral binning, and build the NLTV weights from this image that characterize nonlocal image features; then the NLTV weights are incorporated into a NLTV-based iterative material reconstruction scheme using spectrally-binned projection data, so that these weights serve as a high-SNR reference to regularize material reconstruction.
In the following, first we will describe the TICMR method for spectral CT, including the spectral model (Section II-A), the material-attenuation matrix (Section II-B), the TICMR method (Section II-C), the NLTV regularization (Section II-D), and the solution algorithm (Section II-E); next we will present its validation in comparison with FBP and the TV method using simulated and experimental data (Section III).
II. Method
A. Spectral Model
Consider a set of spectral measurement Yim, i = 1, …, N, m = 1, …, Ne, where Ne is the number of spectral energies, Nυ is the number of projection views, Nd the number of detectors, and N = Nd · Nυ. Let M = N · Ne be the total number of spectral data, s(E) the incident spectrum, ΔEm the length of the mth energy interval, and Li the path of line integral for Yim. Assuming the perfect detector response [27], the expectation of spectral measurement Yim is given by the following spectral model for i = 1, …, N and m = 1, …, Ne
| (1) |
where multi-energy attenuation coefficient u(x, E) linearly depends on the material composition Z [7], i.e.,
| (2) |
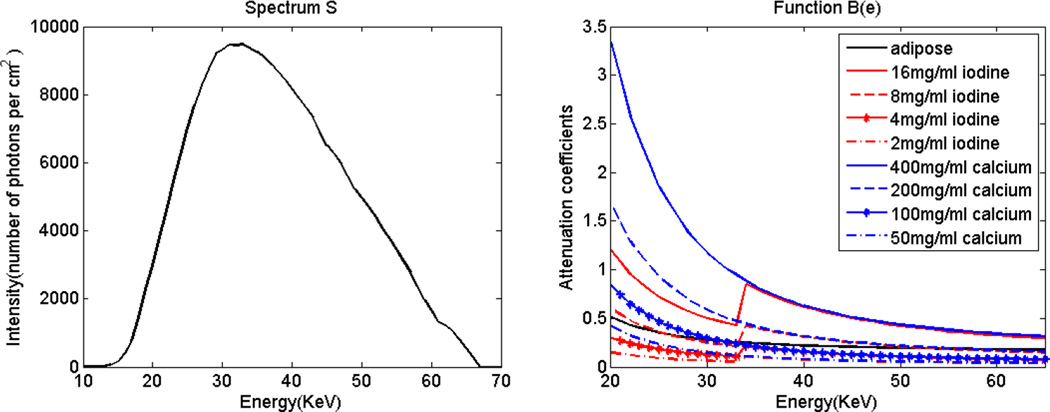
Here Nz is the number of basis materials, Zk(x) is the material composition of the kth basis material at the spatial location x, which is spectrally independent, and Bk(E) is the attenuation coefficient of the kth basis material at the energy E, which is spatially independent. For example, the incident spectrum s(E) with 65KeV tube voltage and B(E) for several materials are plotted in Fig. 1.
Fig. 1.
Incident spectrum at 65KeV and material-attenuation functions.
We then consider a spatially discretized version of (1) with a piecewise-constant spatial grid xj, j = 1, …, Nx. Let A be the system matrix for discretized X-ray transform with the matrix element Aij, e.g., the length of the ray Li overlapping with the grid xj. Then
| (3) |
where Zjk is the kth material composition at the grid xj.
Next we introduce the effective attenuation coefficient Bkm of the kth basis material for the energy interval ΔEm, i.e.,
| (4) |
where
| (5) |
Here (4) is justified by the mean value theorem for definite integrals, thanks to the continuity of B(E) with respect to E.
In the matrix notation, (4) is
| (6) |
where Y* ∈ ℝM is the column vector of spectral measurement, S ∈ ℝM the column vector of source spectrum distribution formed by replicating {sm} in spatial dimension, A ∈ ℝN × Nx the system matrix, Z ∈ ℝNx × Nz the material composition, and B ∈ ℝNz ×Ne the material-attenuation matrix.
Last, assuming Poisson distribution for Y, we consider the following maximum likelihood function to infer Z for Y,
| (7) |
and particularly its logarithmic version
| (8) |
where we have applied a second-order Taylor expansion for e−[AZB]im [28], [·]im denotes the matrix element, and C contains the terms that are independent of Z.
Thus our spectral model to reconstruct material composition Z from spectral measurement Y, i.e., the data fidelity term, can be formulated as the following quadratic functional
| (9) |
where and W = diag(Y) ∈ ℝM ×M.
B. Material-Attenuation Matrix
Here we consider how to determine the material-attenuation matrix Bkm. Based on the previous derivation from Bk(E) to Bkm in (4), we have
| (10) |
Assuming Z is known for the calibration purpose, we can compute B by solving the overdetermined linear system (10).
Alternatively, we rewrite (10) as
| (11) |
Now considering a unit circular/spherical domain of the kth material, (11) is reduced to
| (12) |
Given the material-attenuation function B(E) (e.g., Fig. 1), the material-attenuation matrix B can be efficiently computed by (12).
Here the effective discrete material-attenuation matrix B models the spectral dependence of attenuation coefficients for each material that reduces or alleviates the beam-hardening artifact. However, when only a limited number of energy bins are available, the energy windows ΔEm, i.e., the integration limits for each bin, need to be properly chosen, in order for B to capture the sharp spectral changes, such as the K-edge.
C. Total Image Constrained Material Reconstruction
The proposed TICMR consists of two steps: (i) to reconstruct a total image using spectrally-integrated measurement without spectral binning, and build the NLTV weights from this image that characterize nonlocal image features; (ii) to incorporate these NLTV weights computed from high-SNR total image into material reconstruction using spectrally-resolved projection data.
Let Y0 be the spectrally-integrated measurement, i.e., Y0i = ∑m Yim, i = 1, …, N. Then the total image X* ∈ ℝNx is reconstructed by either filtered backprojection (FBP) or the following TV based iterative method
| (13) |
where with total source energy s0 = ∑m sm, W0 = diag(Y0) ∈ ℝN × N, and |∇X|1 an isotropic TV norm with regularization parameter λ, e.g.,
| (14) |
Then the material composition Z* is reconstructed by the following NLTV based iterative method
| (15) |
where |∇wZ|1 is the NLTV norm that will be given in the next section.
To summarize, TICMR is achieved in this work through the NLTV regularization, during which the total image X* reconstructed by FBP or TV (13) provides high-SNR NLTV weights for the material reconstruction of Z* by (16).
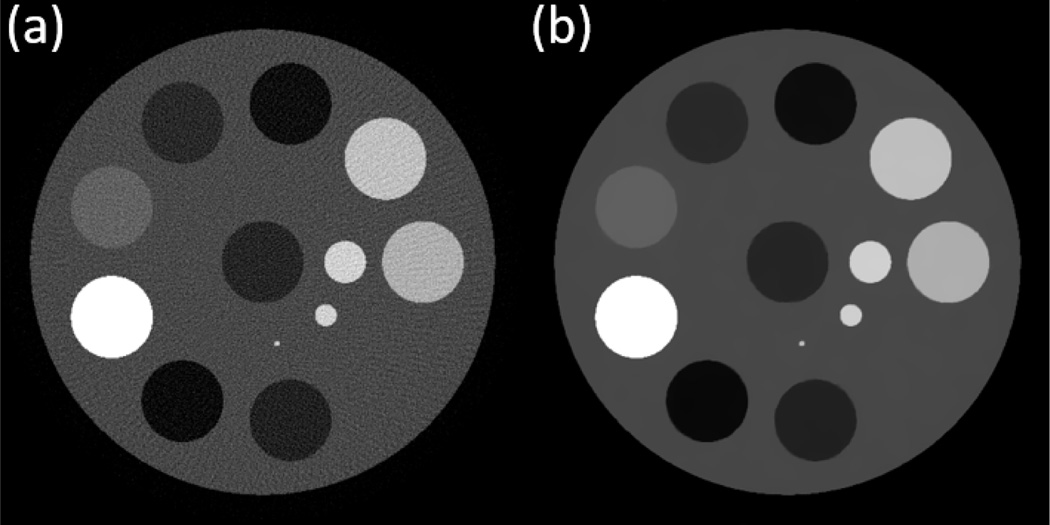
Note that the NLTV regularization in (16) is quite error-forgiving as the weights involve the averaging with Gaussian kernel (18). As a result, the proposed TICMR method is not sensitive to the beam-hardening artifact that may be present in the total image (see Fig. 3(a) and 4(c)). In addition, for the ”invisible” object on the total image that is visible on the spectral image (e.g., Object 3 in Fig. 2), TICMR does not decrease the reconstruction quality (see Fig. 5), although it does not increase the reconstruction quality either since no information is provided by the total image.
Fig. 3.
Total image: (a) FBP; (b) TV.
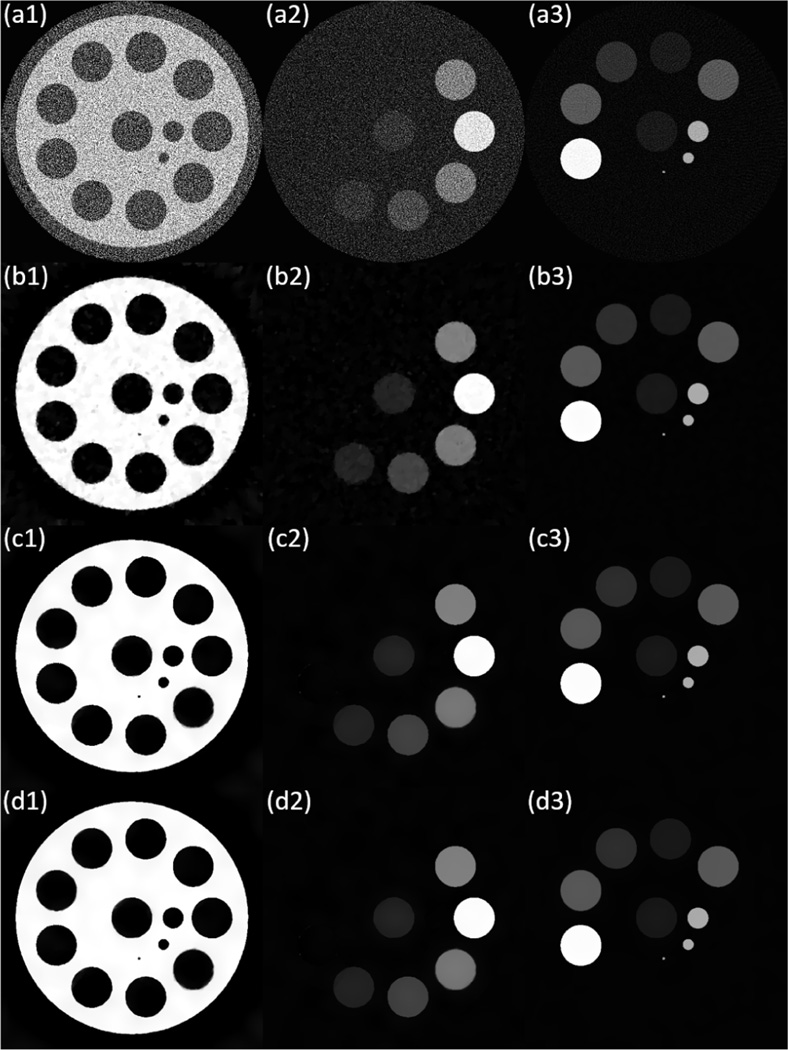
Fig. 4.
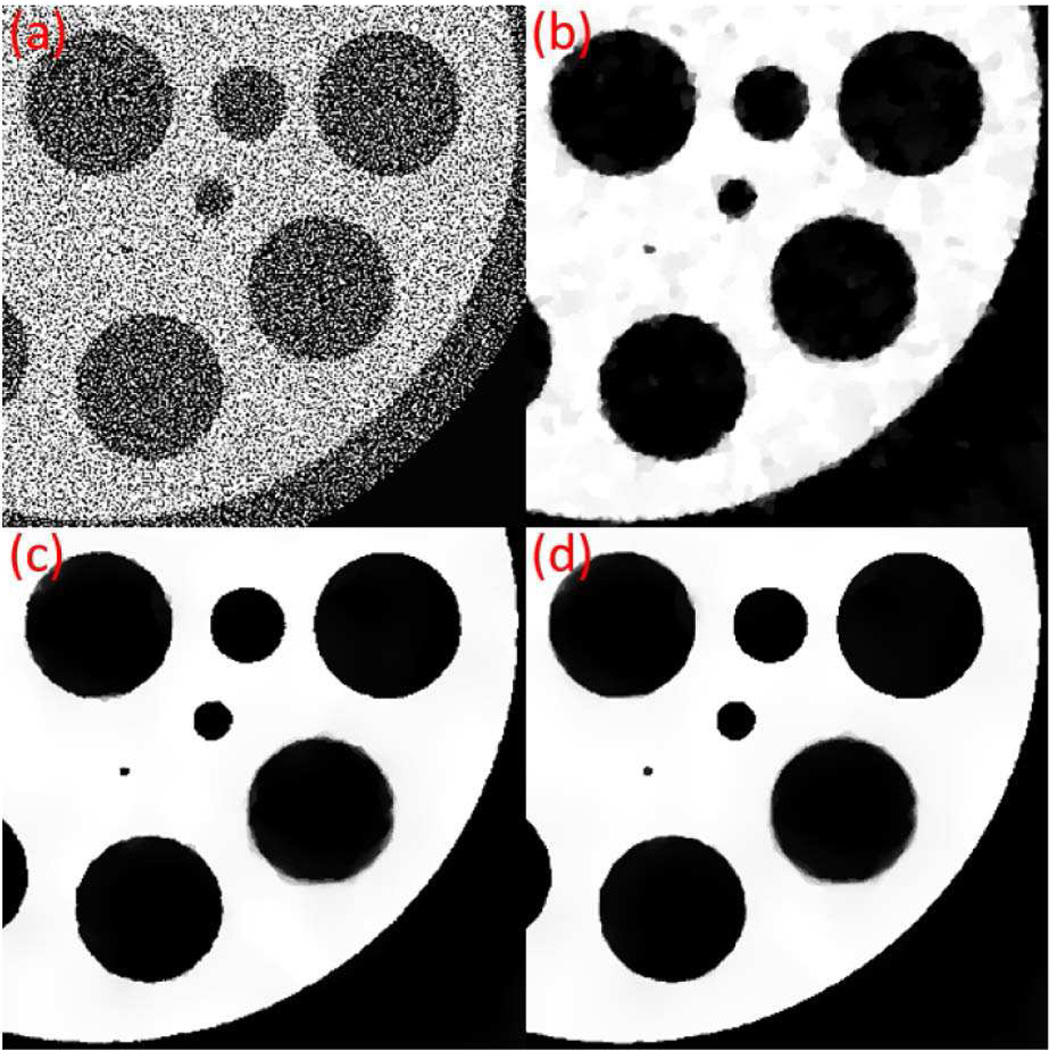
Simulation results. (a) FBP; (b) TV; (c) TICMR_f; (d) TICMR. (1) adipose; (2) iodine; (3) calcium.
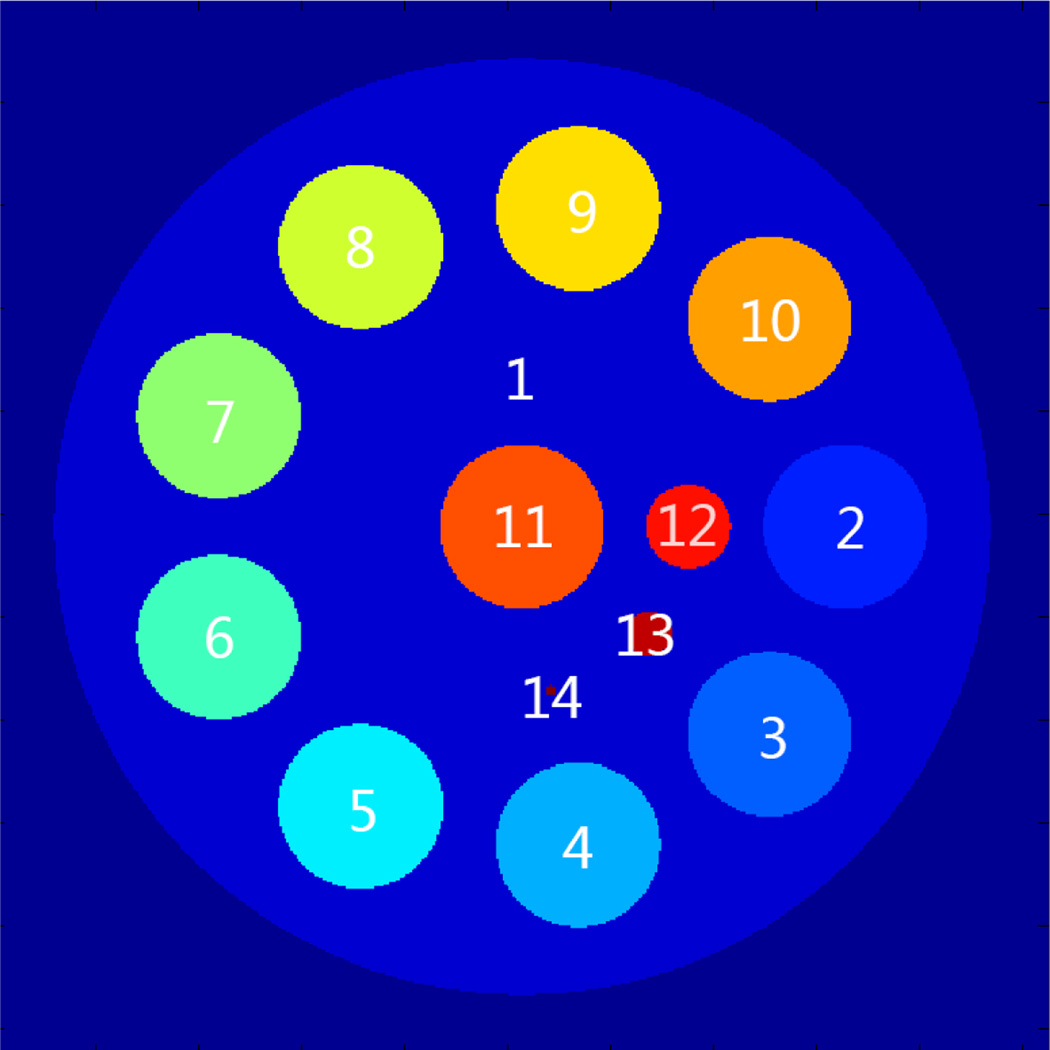
Fig. 2.
The simulation phantom.
Fig. 5.
Zoom-in details. (a) FBP; (b) TV; (c) TICMR_f; (d) TICMR.
In practice, we may consider the following constrained material decomposition model
| (16) |
For example, ZC = D may refer to the constraint where the summation of all material compositions is equal to one in the region-of-interest and zero otherwise.
In the result section, we compare TICMR with FBP and the following TV based material reconstruction
| (17) |
Note that in terms of the regularization in (17), the alternative strategies can be used, such as tensor framelet transform (as a natural high-order generalization of isotropic TV) [3], [11], [29]–[31], and low-rank models [7], [10], [15], [32], [33].
D. Nonlocal Total Variation
An essential component of NLTV is to characterize the patch-by-patch similarity [34] instead of pixel-by-pixel similarity (e.g., TV). That is, for a given image X, the following weights can be constructed between any two spatial node x and y,
| (18) |
where G is a Gaussian kernel with the standard deviation σ, and Ω1 represents the spatial neighborhood to be compared around x and y.
Such a patch-by-patch similarity at the spatial grid x from a high-SNR image X can be used to regularize the low-SNR image u via the following nonlocal gradient at x [25], i.e.,
| (19) |
Here Ω2 is the spatial neighborhood around x where the nonlocal gradient ∇wu(x, y) is computed by (19).
Then the NLTV norm of Z in (16) is given by
| (20) |
where the nonlocal weights w are constructed based on the total image X* reconstructed from (13).
On the other hand, we need to compute the adjoint of (19) during the reconstruction, for which we utilize the following adjoint relationship with a nonlocal divergence operator divw
| (21) |
with the nonlocal divergence operator [25] defined as
| (22) |
As an illustrative example for discretization of the NLTV transform and its adjoint, consider a 2D image u ∈ ℝM×N with Ω1 = ℝ(2a+1)×(2b+1), Ω2 = ℝ(2m+1)×(2n+1), the reference image X based NLTV weights are defined as
| (23) |
and the nonlocal gradient ∇wu ∈ ℝM×N×(2m+1)×(2n+1) can be defined as
| (24) |
where [∇wu]i, j,:,: is the (two-dimensional) submatrix obtained by staking the third and fourth dimensions of ∇wu at each i th position in the first dimension and j th in the second dimension, and its adjoint divw(∇wu) ∈ ℝM×N is
| (25) |
In this work we empirically set a = b = 3, m = n = 5.
E. Solution Algorithm
The solution algorithm for sparsity-based reconstruction problems (13), (16), and (17) is based on alternating direction method of multipliers [35] or split Bregman method [36]. Here we give the details for solving (16).
In order to solve this L1-type problem (16) with non-differentiable L1 norm, we introduce a dummy variable d = ∇wZ to decouple the sparsity regularization from the data fidelity and another dummy variable z = Z to decouple the inequality constraint, i.e.,
| (26) |
Then the augmented Lagrangian of (26) is
| (27) |
To obtain saddle points of the augmented Lagrangian (27) based on ADMM is to iteratively solve
| (28) |
The optimal condition for the first subproblem in (28) provides
| (29) |
The equation (29) is a linear system that can be solved by conjugate gradient method efficiently.
The vector dk+1 in the second subproblem in (28) can be analytically solved by applying the shrinkage operator pointwisely
| (30) |
where the operator .
The vector zk+1 in the third subproblem in (28) can be analytically solved by applying the restriction operator pointwisely
| (31) |
where the operator Π[L,U](x) = min(max(x, L),U).
III. Results
A. Simulation Results
Simulations were performed at tube voltage of 65 kVp. The mean glandular dose was estimated to be approximately 2 mGy for a 10 cm breast with 40% density. A 10 cm PMMA phantom (Fig. 2) which contains both iodine and calcium of various concentrations (Table I) was used. To evaluate the robustness of TICMR, Object 6 had the high contrast with the beam-hardening artifact on the total image, and Object 3 was invisible on the total image.
TABLE I.
The Concentration and Size of Phantom Objects
| Object | Material | Radius | Concentration |
|---|---|---|---|
| 1 | adipose | 48mm | |
| 2 | iodine | 8mm | 16mg/ml |
| 3 | iodine | 8mm | 7.38mg/ml |
| 10 | iodine | 8mm | 8mg/ml |
| 4 | iodine | 8mm | 4mg/ml |
| 5,11 | iodine | 8mm | 2mg/ml |
| 6 | calcium | 8mm | 600mg/ml |
| 7,10 | calcium | 8mm | 200mg/ml |
| 8 | calcium | 8mm | 100mg/ml |
| 9,11 | calcium | 8mm | 50mg/ml |
| 12 | calcium | 4mm | 400mg/ml |
| 13 | calcium | 2mm | 400mg/ml |
| 14 | calcium | 0.6mm | 400mg/ml |
Here the analytic detector response function [27] was utilized to simulate the non-ideal detector response. With properly selected energy intervals, the raw spectral data with non-ideal detector response were corrected to the spectral data for ideal detector response so that the proposed TICMR method can be applied directly based on the model (4) with ideal detector response.
First, 66 measurements were generated linearly with respect to the energy with 1keV gap, i.e.,
| (32) |
where AZB was computed by the parallel computation of X-ray transform [37] with 300 views and 768 detectors per view and with total exposure of 600mR for each energy scan. Here the R matrix is defined as
| (33) |
where the detector response function D(E′, E) is calibrated using X-ray fluorescence [27], and then the Poisson noise was added to the measurements pointwisely, i.e.,
| (34) |
Finally, with a proper choice of energy intervals, the interval 10 ≤ Ẽ ≤ 65 was divided into five energy groups 10 ≤ E1 ≤ 32, 33 ≤ E2 ≤ 39, 40 ≤ E3 ≤ 47, 48 ≤ E4 ≤ 57, 58 ≤ E5 ≤ 65, and then corrected projection data and total projection data were as follows,
| (35) |
and
| (36) |
where , for 1 ≤ m ≤ 5, , for 1 ≤ m, k ≤ 5.
The effective material-attenuation matrix B was calibrated by (12) as follow:
The total image reconstructed with sinogram P̄ (36) by FBP and (13) are respectively shown in Fig. 3.
To compare with the proposed TICMR method (13) and (16) (namely ”TICMR”) and the TICMR method with the total image from FBP (namely ”TICMR_f”), we applied the FBP method to reconstruct material compositions from the material-specific projection data P̂ in (37), i.e.,
| (37) |
In addition, we compared with the TV method (17) that reconstructs material compositions directly from the projection data P in (35). No constraint was applied during any of these methods in the simulation study.
The reconstructed material composition images are shown in Fig. 4 with the zoom-in details in Fig. 5. While TICMR_f (Fig 4(c)) and TICMR (Fig 4(d)) had the similar image quality, they provided significantly improved image quality from FBP (Fig 4(a)) and TV (Fig 4(b)). Note that the small objects of calcium can be clearly observed in the TICMR results, which suggests that the spatial resolution was well preserved.
Regarding the performance of TICMR with respect to the beam-hardening artifact on the total image (i.e., Fig. 3(a)), TICMR was not sensitive to the beam-hardening artifact, since the NLTV regularization in (16) is quite error-forgiving as the weights involve the averaging with Gaussian kernel (18).
Regarding the performance of TICMR with respect to the invisible object on the total image (i.e., Object 3 in Fig. 2), TICMR did not decrease the reconstruction quality (Fig. 5), although it did not increase the reconstruction quality either since no information was provided by the total image.
For quantitative evaluation, the CNR was defined by
| (38) |
where MG, MB are the mean intensity of target and back-ground respectively, and σG, σB are standard deviation of target and background respectively.
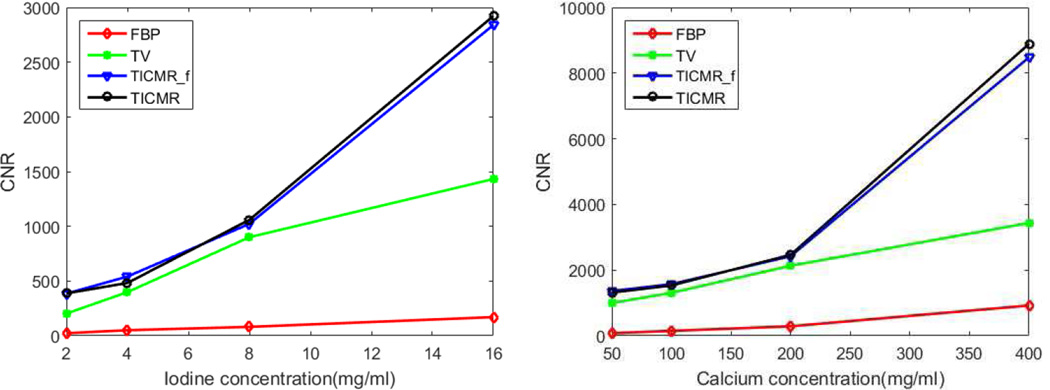
The CNR of iodine and calcium are plotted in Fig. 6, which clearly shows TICMR had the best CNR among all three methods. Here the significant improvement of CNR of TICMR and TV from FBP was due to the piecewise-constant representation of simulation phantom (i.e., the standard deviation was close to 0 in (38)). Comparing with experimental data, the CNR improvement was less due to the fact that the image in reality is not piecewise-constant.
Fig. 6.
Left: CNR of iodine (object 2–5); right: CNR of calcium (object 6–9).
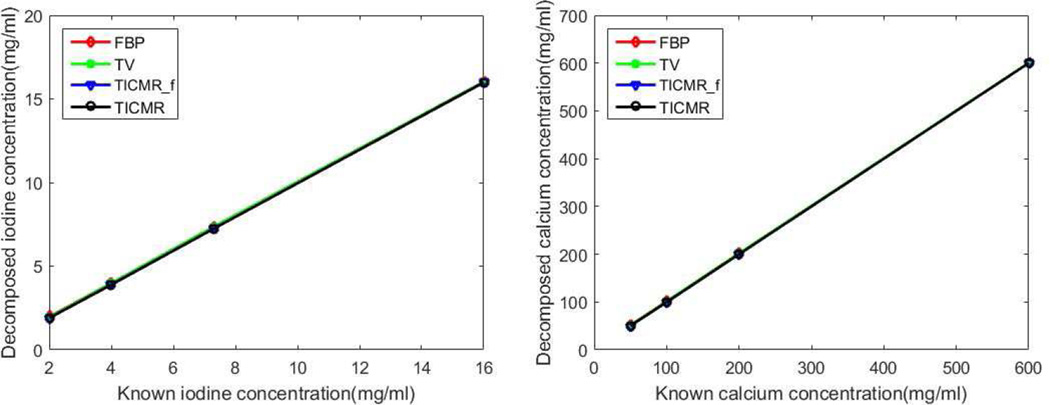
The mean material concentration is plotted in Fig. 7, which shows that all the methods provided the accurate material concentration.
Fig. 7.
Left: material concentration of iodine (object 2–5); right: material concentration of calcium (object 6–9).
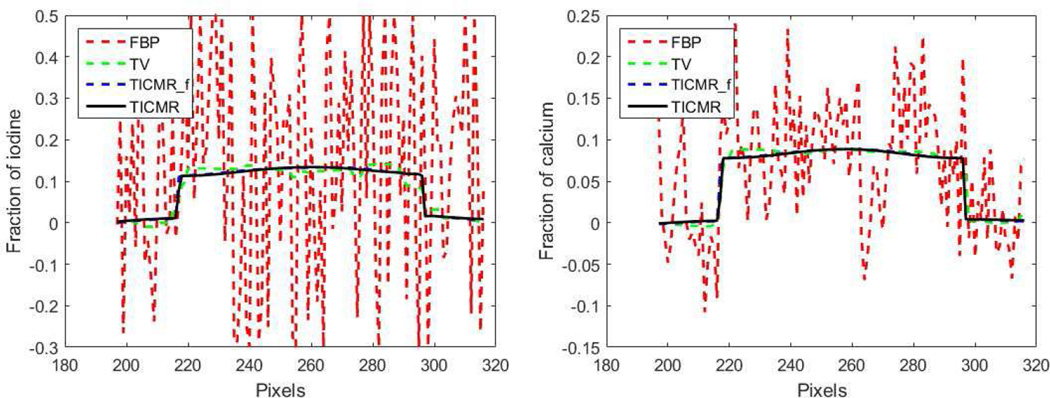
In order to evaluate the spatial resolution of reconstructed material compositions, two material composition curves were drawn along the horizontal and central line passing through Object 11 as shown in Fig. 8, which suggest that the TICMR had the best spatial resolution.
Fig. 8.
Material composition curve along the horizontal and central line passing through Object 11. Left: iodine; right: calcium.
To summarize, the TICMR result had not only the highest SNR, but also the best spatial resolution. This is enabled by high-SNR total image constrained material reconstruction through the NLTV regularization.
B. Experimental Results
Both the calibration phantom data and the postmortem breast tissue data were acquired with a spectral CT system based on a CZT photon-counting detector at a mean glandular dose of 1.2 mGy. All X-ray photons interacting with the CZT detector were sorted into five user-definable energy bins.
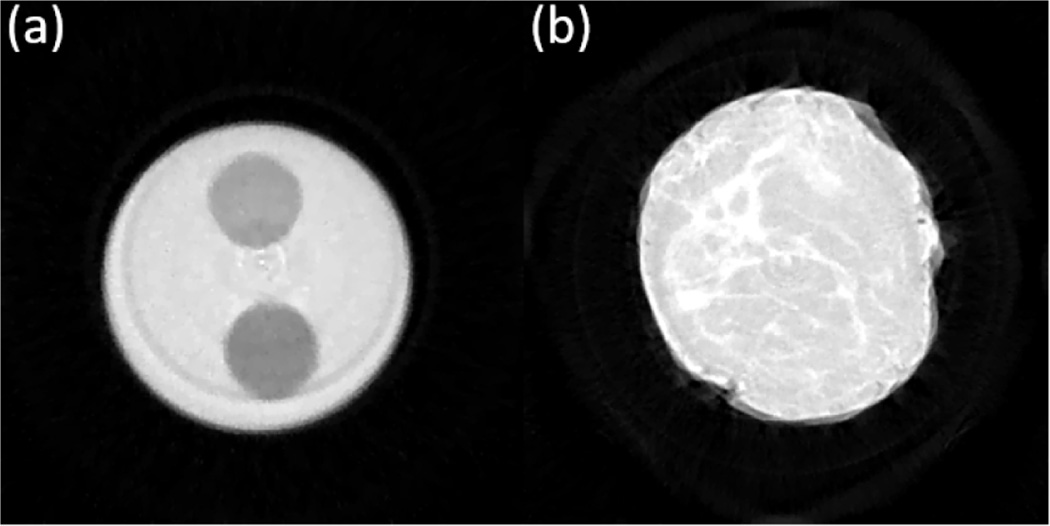
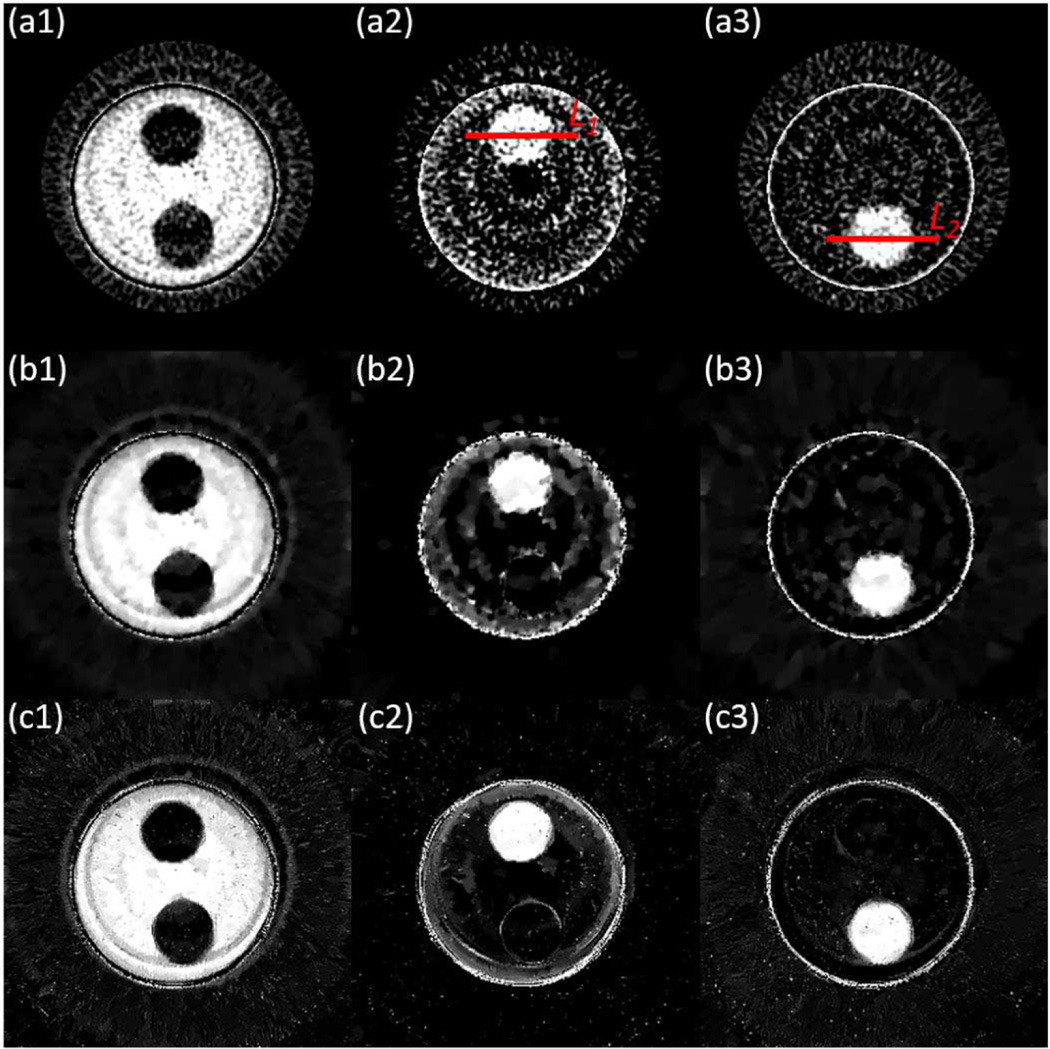
For quantitative analysis, the calibration phantom (Fig. 9(a)) had two inner circles with the water at the top and the lipid at the bottom and its outer circle was filled with the protein. As a result, the material composition was one in the region-of-interest and zero otherwise. Here we applied two constraints in FBP material decomposition method and all iterative reconstruction methods: ZC = D where the sum of material compositions is equal to one in the region-of-interest and zero otherwise, and L ≤ Z ≤ U with L = 0 and U = 1. The B matrix was obtained using another slice in the calibration phantom data that was distinct from the slice as shown in Fig. 9(a).
Fig. 9.
Total image for experimental data: (a) calibration phantom; (b) breast tissue.
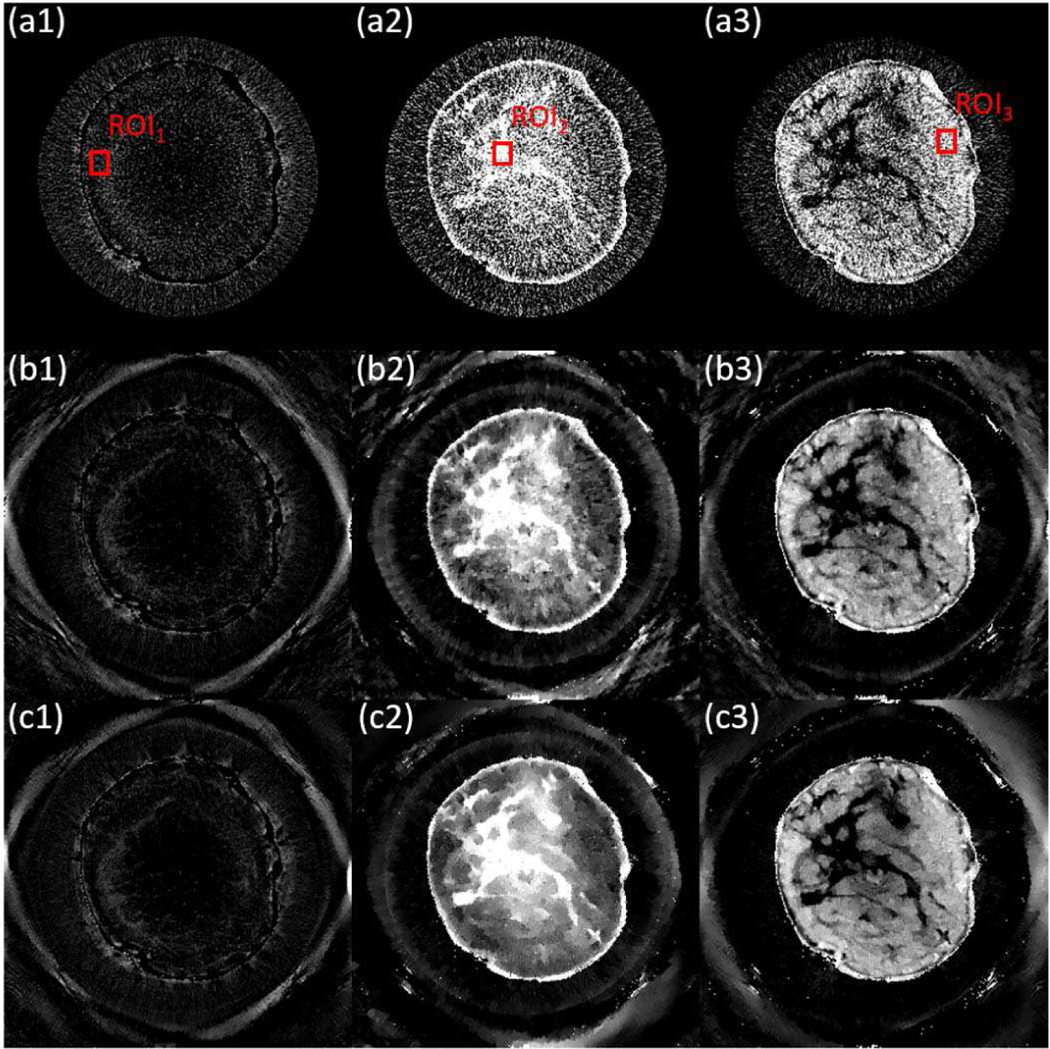
The total image reconstructed with all projection data by (13) is shown in Fig. 9. The reconstructed material compositions are shown in Fig. 10 and Fig. 12 for calibration phantom and breast tissue respectively, which again show that TICMR had improved image quality from FBP and TV. Note that the protein composition in the postmortem breast tissue is much lower than water or lipid.
Fig. 10.
Experimental results for calibration phantom. (a) FBP; (b) TV; (c) TICMR. (1) protein; (2) water; (3) lipid.
Fig. 12.
Experimental results for breast tissue. (a) FBP; (b) TV; (c) TICMR. (1) protein; (2) water; (3) lipid.
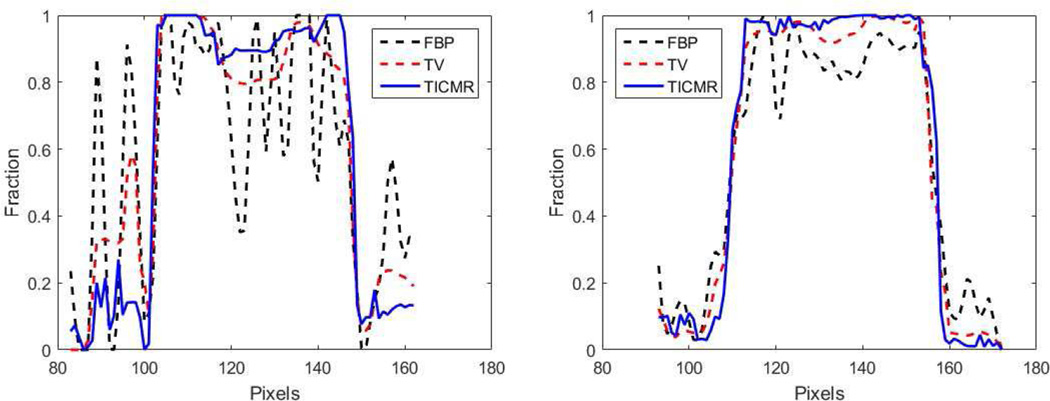
For calibration phantom, since the ground truth was known, the means in the ROI were summarized in Table II, and the spatial profile of two red lines in Fig. 10 is plotted in Fig. 11, which demonstrates that TICMR had improved image quality from FBP and TV in comparison with the ground truth. In addition, the CNR was computed as shown in Table III. For breast tissue, only the CNR was computed as shown in Table IV, i.e., CNR(ROI2, ROI1) and CNR(ROI3, ROI1) for water and lipid respectively with ROI’s drawn in Fig. 12.
TABLE II.
The Mean Results for Calibration Phantom
| Material | Ground Truth | FBP | TV | TICMR |
|---|---|---|---|---|
| protein | 1.000 | 0.982 | 0.981 | 0.996 |
| water | 1.000 | 0.984 | 1.017 | 1.011 |
| lipid | 1.000 | 1.039 | 1.034 | 1.030 |
Fig. 11.
Material composition profile along the line L1 and L2 in Fig. 10. Left: water(L1); right: lipid(L2).
TABLE III.
The CNR Results for Calibration Phantom
| Material | FBP | TV | TICMR |
|---|---|---|---|
| water | 16.26 | 31.42 | 45.48 |
| lipid | 1.26 | 1.51 | 2.24 |
TABLE IV.
The CNR Results for Breast Tissue
| Material | FBP | TV | TICMR |
|---|---|---|---|
| water | 11.67 | 20.16 | 23.78 |
| lipid | 12.33 | 16.34 | 18.89 |
IV. Conclusion
TICMR is proposed for spectral CT with improved image quality, i.e., both CNR and spatial resolution. Such an improvement is enabled by the total image constraint via the NLTV regularization. That is, a high-SNR total image is first reconstructed with energy-integrated projection data of relatively high SNR, and then built into the NLTV weights to regularize the material reconstruction with energy-resolved projection data of relatively low SNR via the NLTV regularization.
Acknowledgments
The authors are grateful to the reviewers and editors for their valuable comments.
Jiulong Liu and Hao Gao were partially supported by the NSFC (#11405105), the 973 Program (#2015CB856000), and the Shanghai Pujiang Talent Program (#14PJ1404500). Xiaoqun Zhang was partially supported by the NSFC (#91330102, #GZ1025) and the 973 Program (#2015CB856000). Huanjun Ding and Sabee Molloi were partially supported by the NIH/NCI (#R01CA13687).
Footnotes
Color versions of one or more of the figures in this paper are available online at http://ieeexplore.ieee.org.
Contributor Information
Jiulong Liu, Department of Mathematics and School of Biomedical Engineering, Shanghai Jiao Tong University, Shanghai 200240, China.
Huanjun Ding, Department of Radiological Sciences, University of California, Irvine, CA 92697 USA.
Sabee Molloi, Department of Radiological Sciences, University of California, Irvine, CA 92697 USA.
Xiaoqun Zhang, Department of Mathematics and Institute of Natural Sciences, Shanghai Jiao Tong University, Shanghai 200240, China.
Hao Gao, Department of Radiation Oncology, Duke University Medical Center, Durham, NC 27710 USA.
References
- 1.Kalender WA, et al. High-resolution spiral CT of the breast at very low dose: Concept and feasibility considerations. Eur. Radiol. 2012;22(1):1–8. doi: 10.1007/s00330-011-2169-4. [DOI] [PubMed] [Google Scholar]
- 2.Ding H, Klopfer MJ, Ducote JL, Masaki F, Molloi S. Breast tissue characterization with photon-counting spectral CT imaging: A postmortem breast study. Radiology. 2014;272(3):731–738. doi: 10.1148/radiol.14132732. [DOI] [PMC free article] [PubMed] [Google Scholar]
- 3.Ding H, Gao H, Zhao B, Cho H-M, Molloi S. A high-resolution photon-counting breast CT system with tensor-framelet based iterative image reconstruction for radiation dose reduction. Phys. Med. Biol. 2014;59(20):6005–6017. doi: 10.1088/0031-9155/59/20/6005. [DOI] [PMC free article] [PubMed] [Google Scholar]
- 4.Roessl E, Proksa R. K-edge imaging in X-ray computed tomography using multi-bin photon counting detectors. Phys. Med. Biol. 2007;52(15):4679–4696. doi: 10.1088/0031-9155/52/15/020. [DOI] [PubMed] [Google Scholar]
- 5.Bornefalk H, Danielsson M. Photon-counting spectral computed tomography using silicon strip detectors: A feasibility study. Phys. Med. Biol. 2010;55(7):1999–2022. doi: 10.1088/0031-9155/55/7/014. [DOI] [PubMed] [Google Scholar]
- 6.Schmidt TG. Optimal ‘image-based’ weighting for energy-resolved CT. Med. Phys. 2009;36(7):3018–3027. doi: 10.1118/1.3148535. [DOI] [PubMed] [Google Scholar]
- 7.Gao H, Yu H, Osher S, Wang G. Multi-energy CT based on a prior rank, intensity and sparsity model (PRISM) Inverse Problems. 2011;27(11):115012. doi: 10.1088/0266-5611/27/11/115012. [DOI] [PMC free article] [PubMed] [Google Scholar]
- 8.Leng S, et al. Noise reduction in spectral CT: Reducing dose and breaking the trade-off between image noise and energy bin selection. Med. Phys. 2011;38(9):4946–4957. doi: 10.1118/1.3609097. [DOI] [PubMed] [Google Scholar]
- 9.Zhao B, et al. Dual-dictionary learning-based iterative image reconstruction for spectral computed tomography application. Phys. Med. Biol. 2012;57(24):8217–8229. doi: 10.1088/0031-9155/57/24/8217. [DOI] [PMC free article] [PubMed] [Google Scholar]
- 10.Li L, Chen Z, Wang G, Chu J, Gao H. A tensor PRISM algorithm for multi-energy CT reconstruction and comparative studies. J. X-Ray Sci. Technol. 2013;2:147–163. doi: 10.3233/XST-140416. [DOI] [PubMed] [Google Scholar]
- 11.Zhao B, Gao H, Ding H, Molloi S. Tight-frame based iterative image reconstruction for spectral breast CT. Med. Phys. 2013;40(3):031905. doi: 10.1118/1.4790468. [DOI] [PMC free article] [PubMed] [Google Scholar]
- 12.Clark DP, Badea CT. Spectral diffusion: An algorithm for robust material decomposition of spectral CT data. Phys. Med. Biol. 2014;59(21):6445–6466. doi: 10.1088/0031-9155/59/21/6445. [DOI] [PMC free article] [PubMed] [Google Scholar]
- 13.Manhart M, Fahrig R, Hornegger J, Doerfler A, Maier A. Guided noise reduction for spectral CT with energy-selective photon counting detectors. Proc. CT Meet. 2014:91–94. [Google Scholar]
- 14.Xi Y, Chen Y, Tang R, Sun J, Zhao J. United iterative reconstruction for spectral computed tomography. IEEE Trans. Med. Imag. 2015 Mar;34(3):769–778. doi: 10.1109/TMI.2014.2339497. [DOI] [PubMed] [Google Scholar]
- 15.Kim K, et al. Sparse-view spectral CT reconstruction using spectral patch-based low-rank penalty. IEEE Trans. Med. Imag. 2015 Mar;34(3):748–760. doi: 10.1109/TMI.2014.2380993. [DOI] [PubMed] [Google Scholar]
- 16.Shen L, Xing Y. Multienergy CT acquisition and reconstruction with a stepped tube potential scan. Med. Phys. 2015;42:282–296. doi: 10.1118/1.4903756. [DOI] [PubMed] [Google Scholar]
- 17.Alvarez RE, Macovski A. Energy-selective reconstructions in X-ray computerised tomography. Phys. Med. Biol. 1976;21(5):733–744. doi: 10.1088/0031-9155/21/5/002. [DOI] [PubMed] [Google Scholar]
- 18.Schirra CO, et al. Statistical reconstruction of material decomposed data in spectral CT. IEEE Trans. Med. Imag. 2013 Jul;32(7):1249–1257. doi: 10.1109/TMI.2013.2250991. [DOI] [PubMed] [Google Scholar]
- 19.Xu Q, Sawatzky A, Anastasio MA, Schirra CO. Sparsity-regularized image reconstruction of decomposed K-edge data in spectral CT. Phys. Med. Biol. 2014;59(10):N65–N79. doi: 10.1088/0031-9155/59/10/N65. [DOI] [PMC free article] [PubMed] [Google Scholar]
- 20.Taguchi K, Iwanczyk JS. Vision 20/20: Single photon counting X-ray detectors in medical imaging. Med. Phys. 2013;40(10):100901. doi: 10.1118/1.4820371. [DOI] [PMC free article] [PubMed] [Google Scholar]
- 21.Sukovic P, Clinthorne NH. Penalized weighted least-squares image reconstruction for dual energy X-ray transmission tomography. IEEE Trans. Med. Imag. 2000 Nov;19(11):1075–1081. doi: 10.1109/42.896783. [DOI] [PubMed] [Google Scholar]
- 22.Elbakri IA, Fessler JA. Statistical image reconstruction for polyenergetic X-ray computed tomography. IEEE Trans. Med. Imag. 2002 Feb;21(2):89–99. doi: 10.1109/42.993128. [DOI] [PubMed] [Google Scholar]
- 23.Long Y, Fessler JA. Multi-material decomposition using statistical image reconstruction for spectral CT. IEEE Trans. Med. Imag. 2014 Aug;33(8):1614–1626. doi: 10.1109/TMI.2014.2320284. [DOI] [PMC free article] [PubMed] [Google Scholar]
- 24.Zhao Y, Zhao X, Zhang P. An extended algebraic reconstruction technique (E-ART) for dual spectral CT. IEEE Trans. Med. Imag. 2015 Mar;34(3):761–768. doi: 10.1109/TMI.2014.2373396. [DOI] [PubMed] [Google Scholar]
- 25.Gilboa G, Osher S. Nonlocal operators with applications to image processing. Multiscale Model. Simul. 2008;7(3):1005–1028. [Google Scholar]
- 26.Zhang X, Burger M, Bresson X, Osher S. Bregmanized nonlocal regularization for deconvolution and sparse reconstruction. SIAM J. Imag. Sci. 2010;3(3):253–276. [Google Scholar]
- 27.Ding H, Cho H-M, Barber WC, Iwanczyk JS, Molloi S. Characterization of energy response for photon-counting detectors using X-ray fluorescence. Med. Phys. 2014;41(12):121902. doi: 10.1118/1.4900820. [DOI] [PMC free article] [PubMed] [Google Scholar]
- 28.Sauer K, Bouman C. A local update strategy for iterative reconstruction from projections. IEEE Trans. Signal Process. 1993 Feb;41(2):534–548. [Google Scholar]
- 29.Gao H, Li R, Lin Y, Xing L. 4D cone beam CT via spatiotemporal tensor framelet. Med. Phys. 2012;39(11):6943–6946. doi: 10.1118/1.4762288. [DOI] [PMC free article] [PubMed] [Google Scholar]
- 30.Gao H, Qi XS, Gao Y, Low DA. Megavoltage CT imaging quality improvement on TomoTherapy via tensor framelet. Med. Phys. 2013;40(8):081919. doi: 10.1118/1.4816303. [DOI] [PMC free article] [PubMed] [Google Scholar]
- 31.Zhou W, Cai J-F, Gao H. Adaptive tight frame based medical image reconstruction: A proof-of-concept study for computed tomography. Inverse Problems. 2013;29(12):125006. [Google Scholar]
- 32.Gao H, Cai J-F, Shen Z, Zhao H. Robust principal component analysis-based four-dimensional computed tomography. Phys. Med. Biol. 2011;56(11):3181. doi: 10.1088/0031-9155/56/11/002. [DOI] [PMC free article] [PubMed] [Google Scholar]
- 33.Cai J-F, et al. Cine cone beam CT reconstruction using low-rank matrix factorization: Algorithm and a proof-of-principle study. IEEE Trans. Med. Imag. 2014 Aug;33(8):1581–1591. doi: 10.1109/TMI.2014.2319055. [DOI] [PMC free article] [PubMed] [Google Scholar]
- 34.Buades A, Coll B, Morel JM. A review of image denoising algorithms, with a new one. Multiscale Model. Simul. 2005;4(2):490–530. [Google Scholar]
- 35.Boyd S, Parikh N, Chu E, Peleato B, Eckstein J. Distributed optimization and statistical learning via the alternating direction method of multipliers. Found. Trends Mach. Learn. 2011;3(1):1–122. [Google Scholar]
- 36.Goldstein T, Osher S. The split Bregman method for L1-regularized problems. SIAM J. Imag. Sci. 2009;2(2):323–343. [Google Scholar]
- 37.Gao H. Fast parallel algorithms for the X-ray transform and its adjoint. Med. Phys. 2012;39(11):7110–7120. doi: 10.1118/1.4761867. [DOI] [PMC free article] [PubMed] [Google Scholar]


