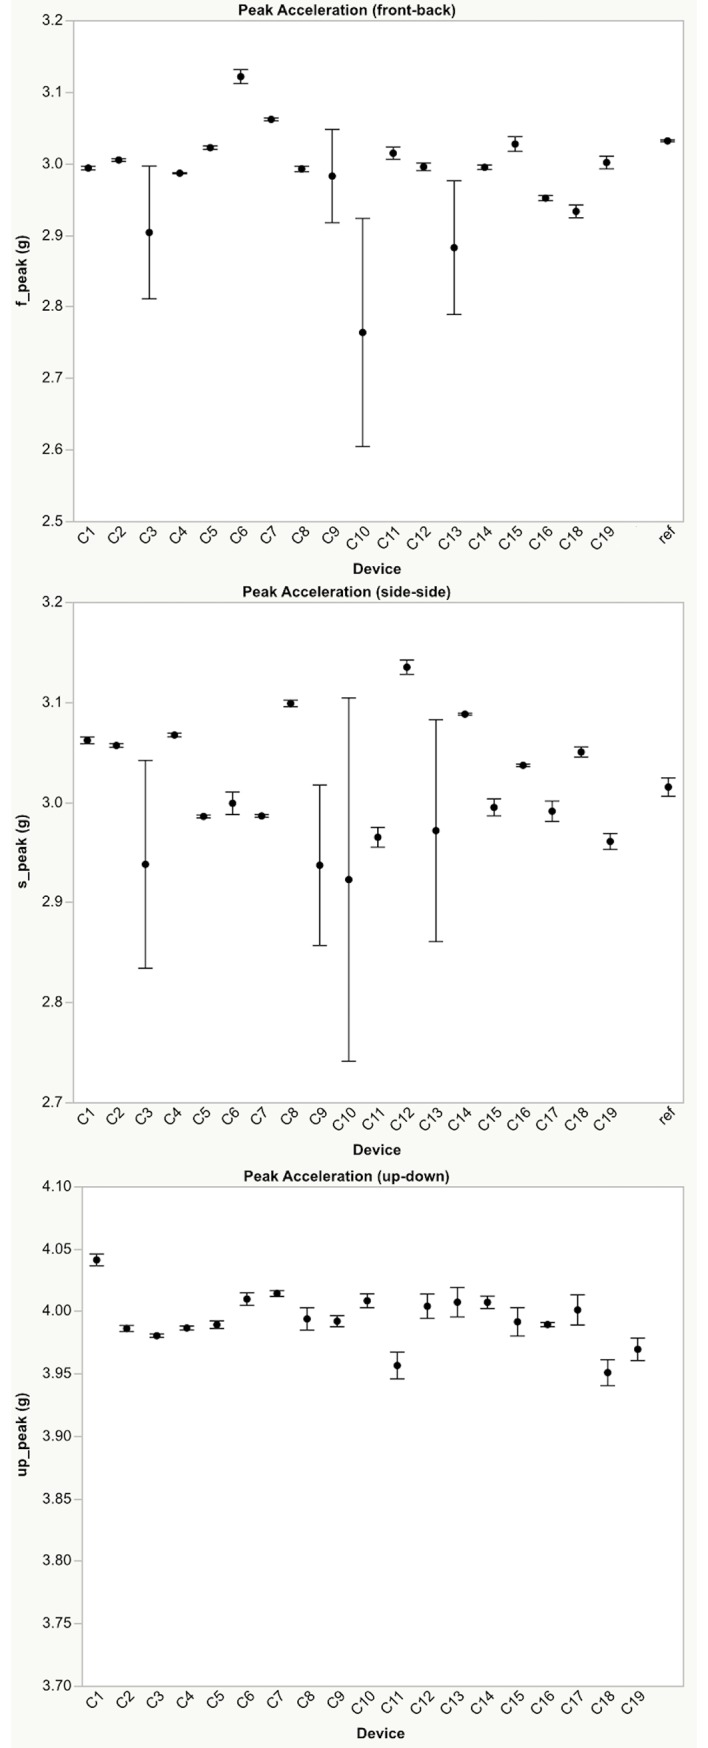
Fig 3. Peak accelerations.

Mean ±95% confidence intervals peak acceleration measured by each device resulting from oscillatory motion applied in the top) x-direction (front-back), middle) y-direction (side-side), and bottom) z-direction (up-down) with 3g peak acceleration (8 Hz). Note: Data from device C17 was an outlier and was removed from the x-direction plot. The reference accelerometer is gravity corrected and is not shown on the z-direction plot. Please see Supporting Information for complete data set (S1 Data).
