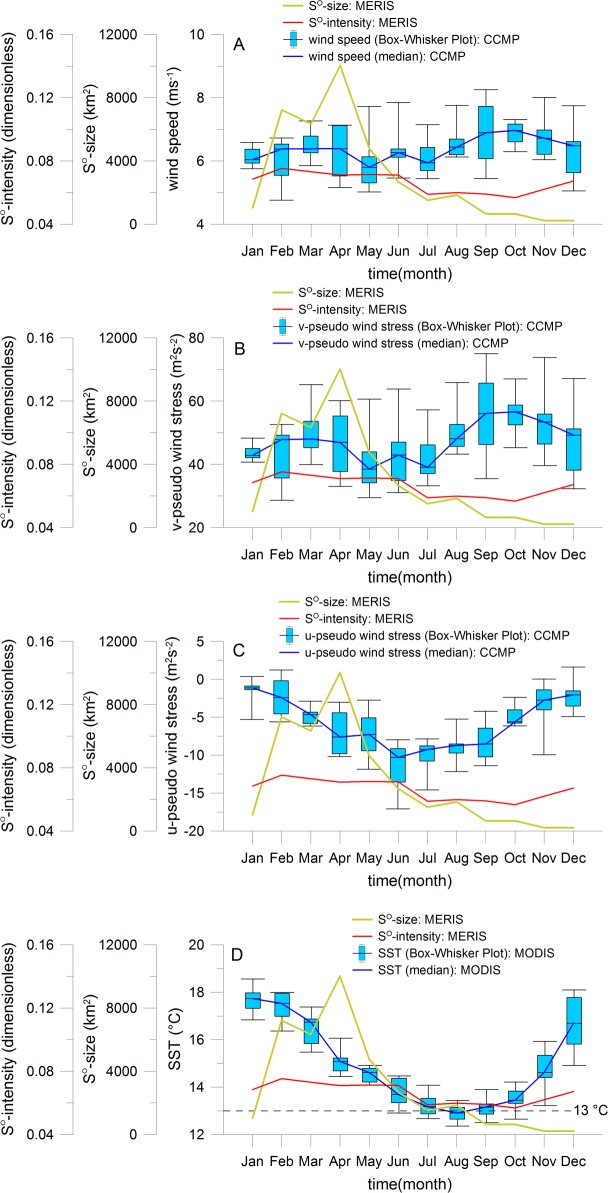
Fig 7. Seasonal variability of sulphur plumes in relation to local forcing.
Seasonal climatology of sulphur plume size and intensity, of wind speed at 10 m high of CCMP data set (A), of v-component of pseudo wind stress at 10 m high of CCMP (B), of corresponding u-component of pseudo wind stress (C) and of MODIS sea surface temperature (D). The yellow and red curves in each of these figures correspond to the monthly size and intensity of sulphur plumes derived from all MERIS data of years 2002 to 2012, respectively. For the wind and SST products, Box-Whisker plots with monthly minimum, maximum, median, 25th and 75th percentiles were calculated over the main upwelling cells between Walvis Bay and Lüderitz. The blue curves represent the median values.

