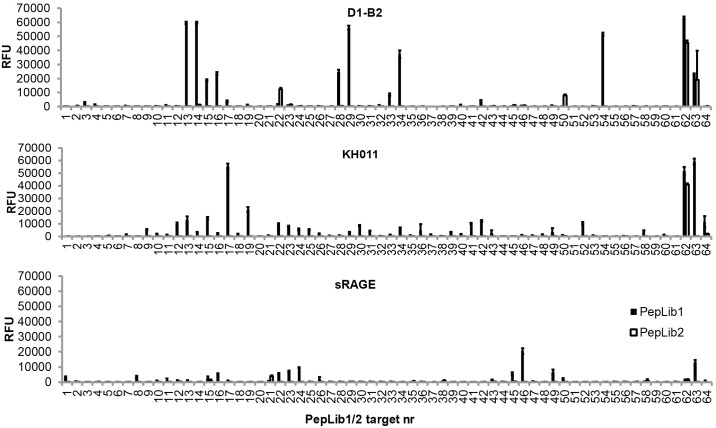
Fig 1. Binding of D1-B2, KH011, and recombinant sRAGE to PepLib1 and PepLib2 printed on microarrays.
Histograms are plotted as relative fluorescense units (RFU) against peptide number. For specifications of peptides, see S1 Table for PepLib1 and S2 Table for PepLib2. In-spot standard deviations are displayed in the bars. For quantified data of the binding of D1-B2 to these libraries, see S5 and S6 Tables, respectively.

