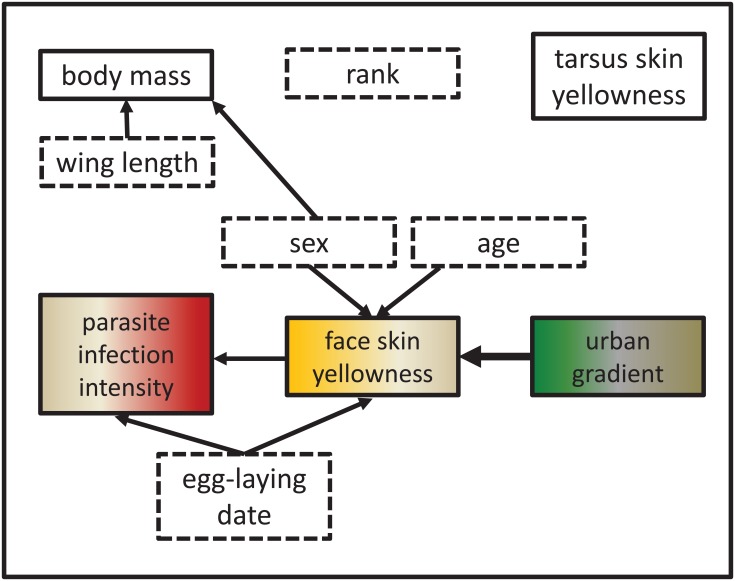
Fig 6. Schematic diagram showing interrelations of health-related variables in urban kestrel nestlings.
Variables in solid-lined boxes have been used as response and explanatory variables in GLMMs, variables in dashed boxes only as explanatory variables. The arrow for the urban gradient is displayed in bold to underline its importance in the main hypotheses.

