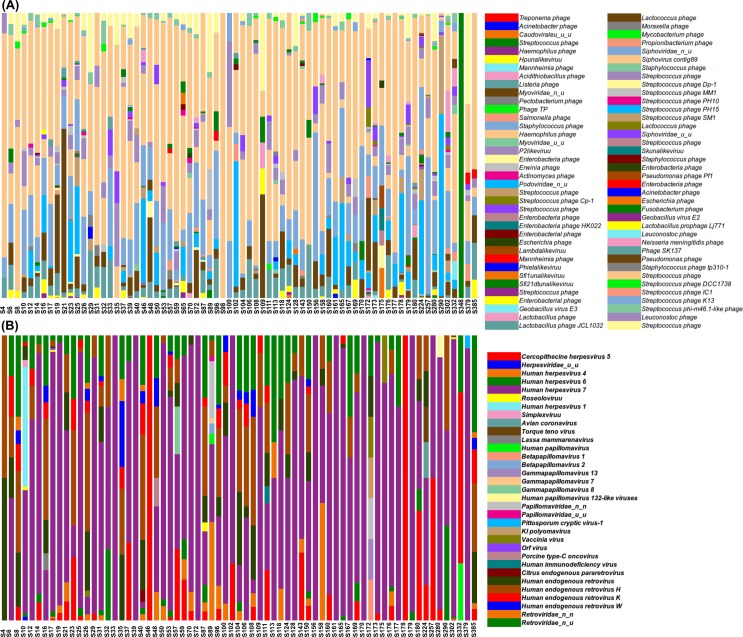
Fig 2.
Barplots showing the relative abundance of the bacteriophages (A) and eukaryotic viruses (B), at the species level, identified by sample. The order of the viruses in the legend is based on the alphabetical order of their full taxonomic assignment (see S4 Table in SI for it). Viruses displayed in the legend are sorted in ascending order in the bars, i.e., the first viruses in the legend appear at the bottom of the bar, whereas the last ones are displayed at the top of the bars.

