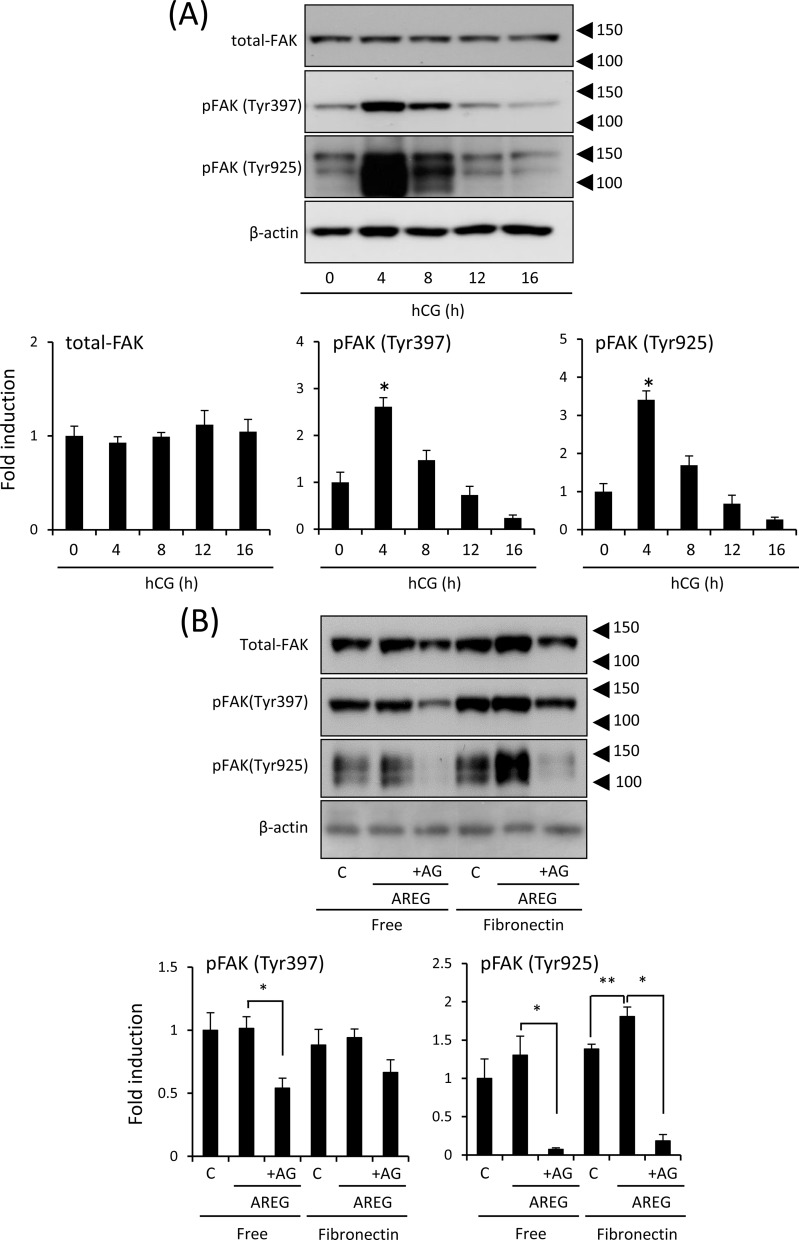
Fig 2. Expression of phosphorylation of FAK in the mouse ovary during ovulation.
(A): Levels of FAK (total FAK), phosphorylated forms of FAK (Tyr397 and Tyr925), and β-actin in whole ovary samples were detected by western blot analyses. The ovary was collected from mice treated with hCG. Three mice were used for ovarian sampling at each time point. β-actin was used as a loading control. The intensity of the bands was analyzed and values are mean +/- SEM of 3 replicates. *; Significant differences were observed by hCG injection as compared with those before hCG injection (0h) (P<0.05). (B): Phosphorylation status of FAK in granulosa cells cultured for 4 h with or without AREG on uncoated or fibronectin-coated plates. C (control): granulosa cells cultured without AREG; AREG: granulosa cells treated with 100 ng/ml AREG; AG: granulosa cells treated with both AREG and 10 μM AG1478 (AG, a selective EGFR tyrosine kinase inhibitor); Free: granulosa cells cultured on uncoated wells; Fibronectin: granulosa cells cultured on fibronectin-coated wells. β-actin was used as a loading control. The intensity of the bands was analyzed and values are mean +/- SEM of 3 replicates. *; Significant differences were observed by the addition of AG1478 (AG) (P<0.05). **; The treatment with AREG significantly increased the intensity of pFAK (Tyr925) in granulosa cells cultured on the fibronectin-coated wells (P<0.05).

