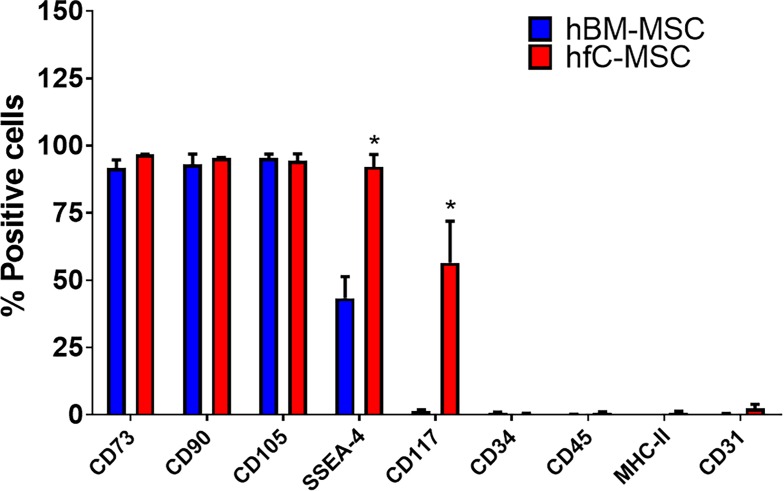
Fig 2. Phenotypic characteristics of hfC-MSCs compared to BM-MSCs.
Representative bar graphs showing a comparison of the expression of CD73, CD90, CD105, SSEA-4, CD117, CD34, CD45, HLA-DR and CD31 on hfC-MSCs and hBM-MSCs as demonstrated by flow cytometry. Values are mean ± SE of three independent experiments of both the cell types at passage-5.

