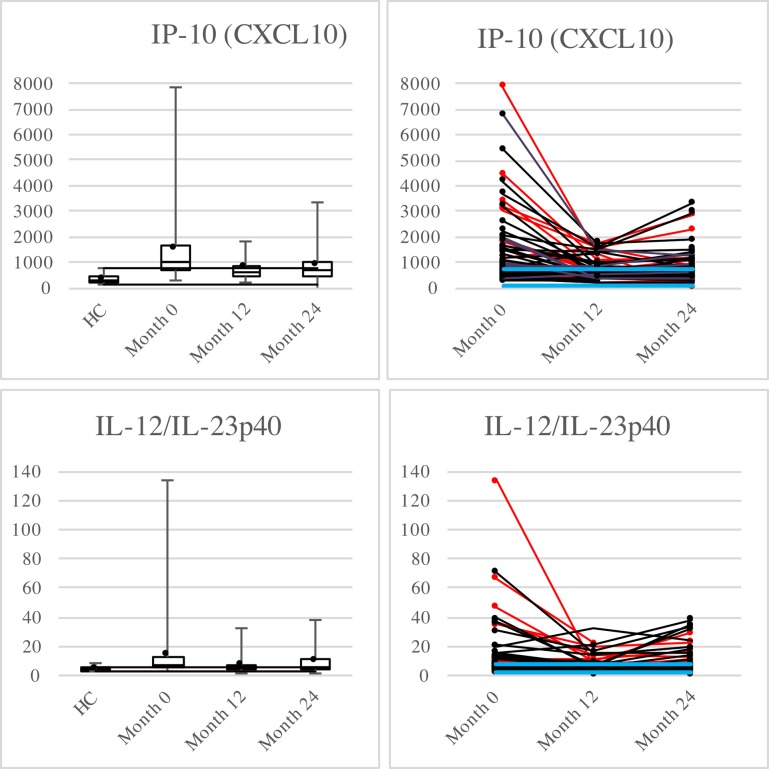
Fig 2. Box-plots and dot-line diagram for IP-10 and IL-12/IL-23p40.
All values in pg/mL. In the box-plots the whiskers represent the min/max respectively, dots represent the mean and the black lines mark the level of the lowest/highest value within Q1-1.5xIQR/Q3+1.5xIQR respectively. The dot-line diagrams display the values for each MS patient. HC are not included. Patients displaying subclinical inflammatory activity on MRI at any time point during the STRIX-study are marked by red lines and dots, patients without radiological activity are marked by black. The green lines represent LLoQ and the blue lines min/max value respectively for HC.

