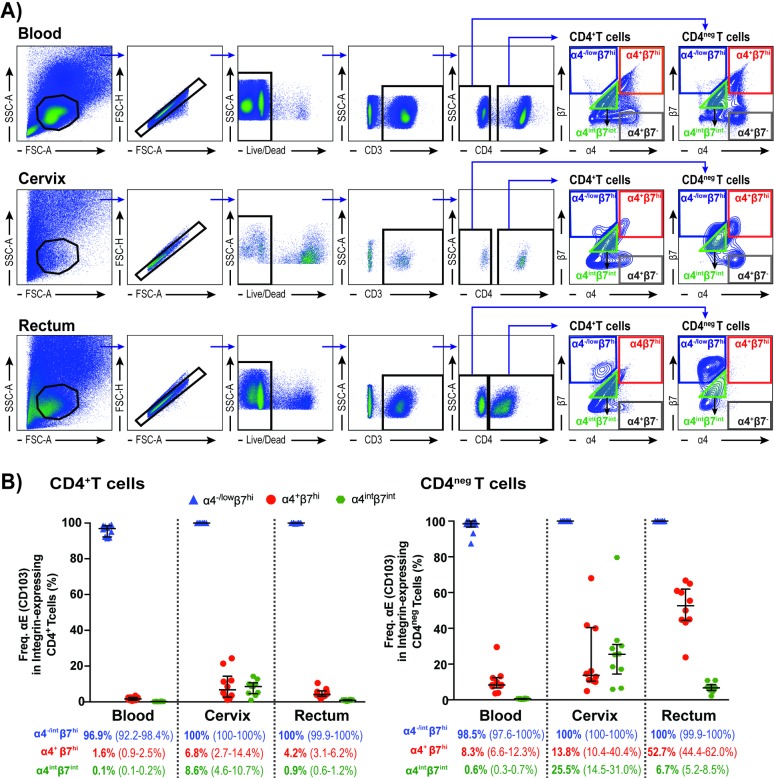
Fig 1. Anti-α4 and anti- β7 co-staining as means to the identification of αE+β7hi T cell population.
(A) Representative flow cytometry plots for the identification of α4-/negβ7hi, α4+β7hi, α4intβ7int and α4+β7-T cell populations in blood, cervix and rectum; (B) Frequency of α4-/lowβ7hi, α4intβ7int and α4+β7hi on CD4+ and CD4negT cells expressing αE. Data from 10 female subjects presented as median and interquartile range (IQR).

