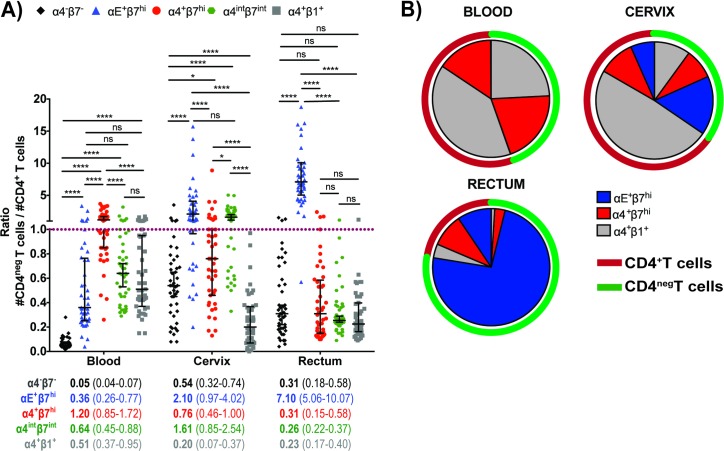
Fig 5. Integrin-expressing CD4+ and CD4negT cell densities in the blood, cervix and rectum.
(A) CD4neg:CD4+ ratio of all CD3+cells expressing α4-β7-, αE+β7hi, α4+β7hi, α4intβ7int or α4+β1+ in blood, cervix and rectum. (B) The densities of αE+β7hi, α4+β7hi and α4+β1+T cells in this pie charts were drawn based on integrin-expressing T cells in each tissue and does not account for the total density of T cells in each site. Data from 45 female subjects presented as median (IQR). *P < 0.05 **P < 0.01 ***P < 0.001 ****P < 0.0001, as calculated by Friedman Test, followed by Wilcoxon signed rank-test, and adjusted for multiple comparisons using step-down procedure.

