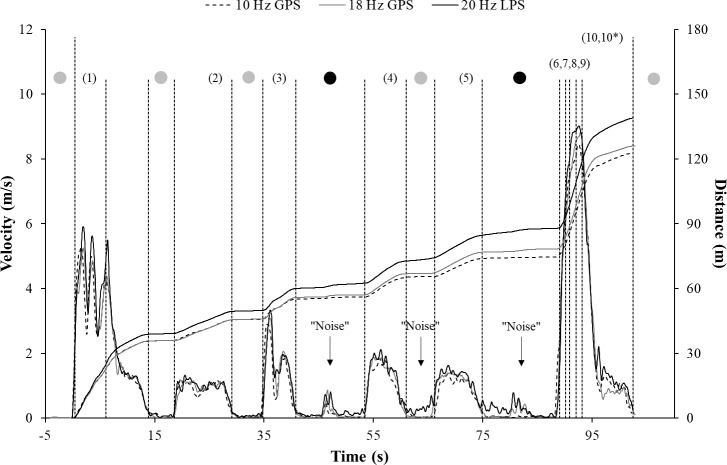
Fig 2. Exemplary plots of the filtered velocity data and resulting distances covered as measured by the positioning systems during the circuit.
GPS = Global positioning system; LPS = local positioning system. While the number in brackets presents the section of the measurement within the circuit, the colored points show the standing phases(Fig 1). The vertical lines indicate the thresholds that were used to detect the start and end of the section within the circuit (see text). The entire distance covered was calculated twice: from the start to the end of the circuit (10) and through the summation of the single walking, jogging, and sprinting sections to correct for the noise observed during standing (10*).

