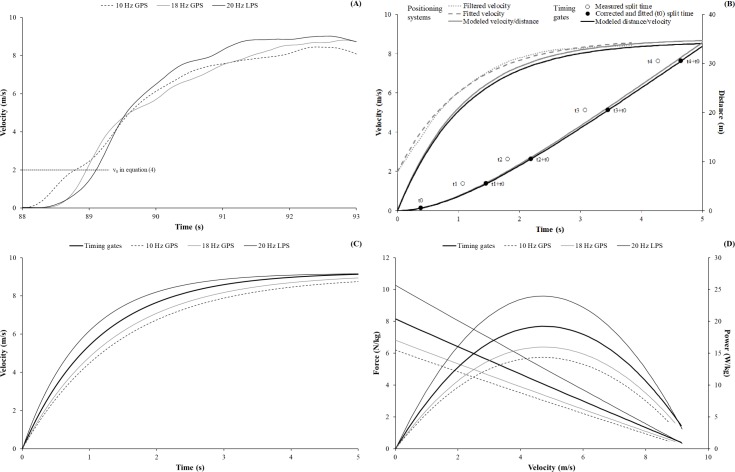
Fig 3.
Exemplary plots for our applied data processing to model the sprint mechanical properties via the filtered velocity data and split times measured by the positioning systems and timing gates, respectively (B). For each technology, an exemplary plot for the filtered velocity data (A), modeled velocity data (C), and derived sprint mechanical properties (D) is also shown. GPS = Global positioning system; LPS = local positioning system. In (B), the grey functions show the data processing procedures applied to the filtered velocity data (A) measured by the positioning systems (i.e., exemplary shown for the LPS), whereas the black data represent the procedures applied to the split times assessed by the timing gates (see text). In (D), the theoretical horizontal force and power output is plotted over the modeled velocity (C) to exemplary show linear force-velocity and parabolic power-velocity profiles.

