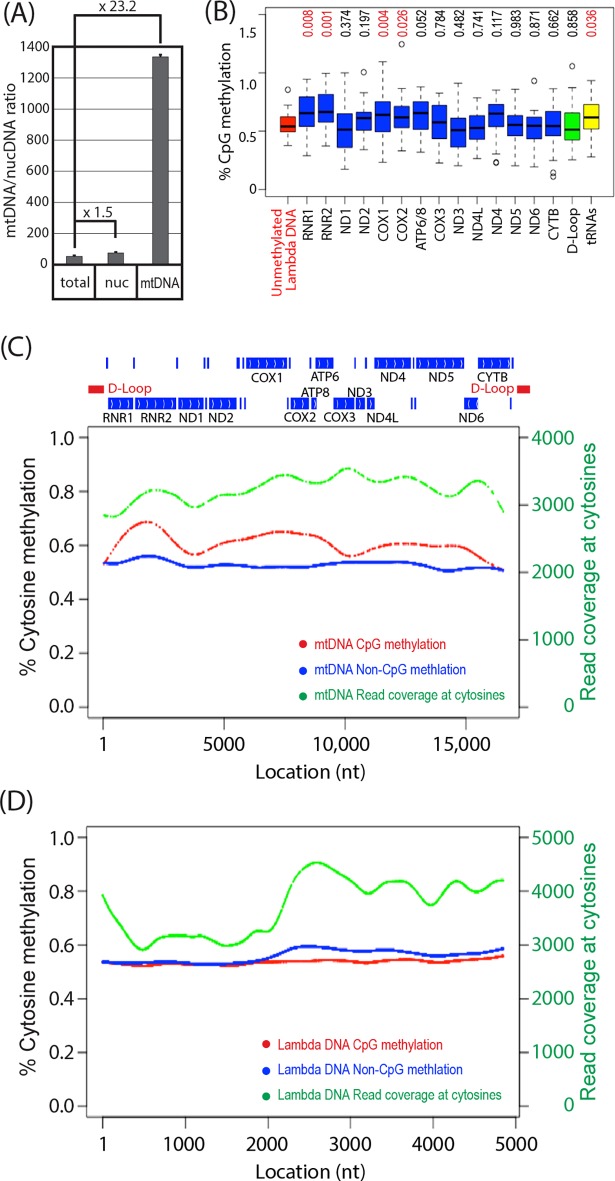
Fig 6. Shotgun bisulfite sequencing of human iPSC mtDNA.
(A) Ratios of copy numbers of human mtDNA and nuclear DNA were determined by qPCR of mtDNA and nuclear DNA marker genes (Mean±SD, triplicated assays). Numbers show fold enrichment compared to total DNA. (B) CpG methylation of mtDNA-encoded genes (box plot; boxes and whiskers indicate quartiles and minimum/maximum values, horizontal lines in boxes indicate median). Numbers at the top indicate p-values of 2-tailed t-test against unmethylated lambda DNA. (C, D) Cytosine methylation of mtDNA (C) and unmethylated lambda DNA (D). Percentage of cytosine methylation in the CpG and non-CpG contexts is shown with red and blue dots, respectively. Deep sequencing read coverage at cytosines is shown with green dots. In panel (C), locations of mtDNA-encoded genes and D-loop are indicated at the top, where positions of tRNA genes are shown with vertical bars without gene names.

