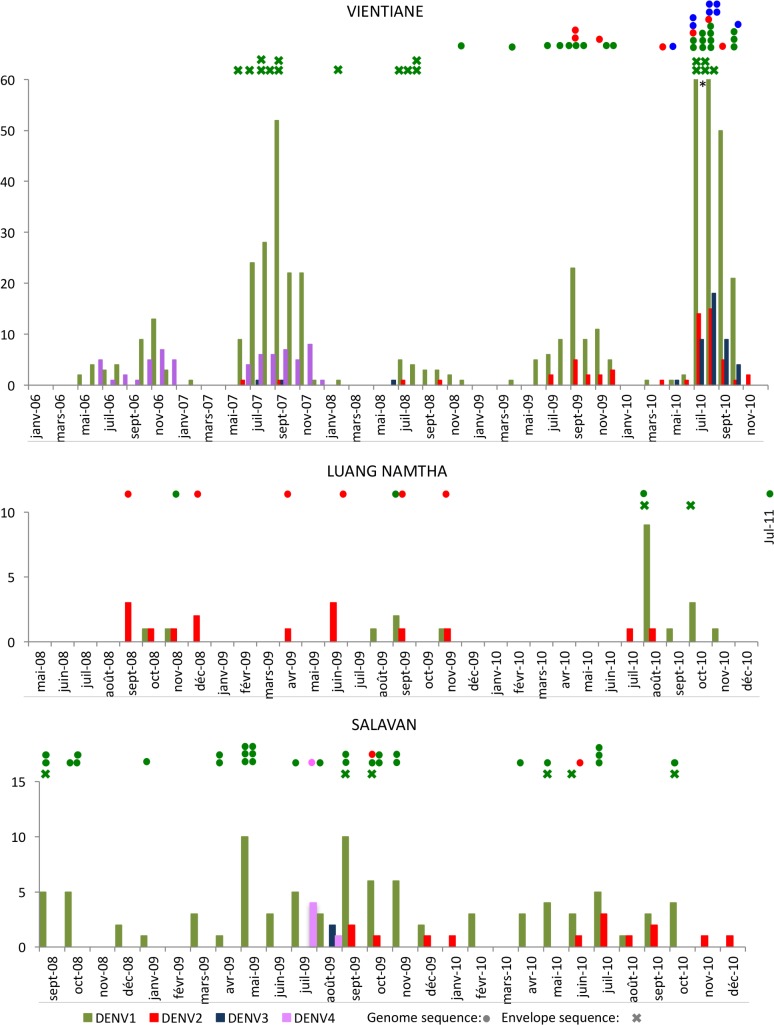
Fig 3. Dengue virus serotypes distribution over time at the three sites.
Available sequences for each site are indicated with circles for complete CDS and with crosses for envelope on the top of the histograms, including sequences previously published from same locations [23].

