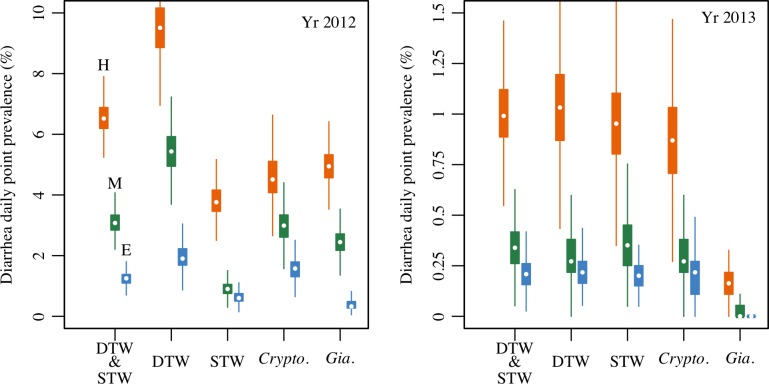
Fig 4. Boxplots of simulated diarrhea daily point prevalence (% of children).
Prevalence is shown for the study population during the 90-day monsoon season estimated from 1,000 simulations of the quantitative microbial risk assessment and susceptible-infected-recovered models. Results shown for deep (DTW) and shallow (STW) tubewell users (either infection), and for Cryptosporidium (Crypto.) and Giardia (Gia.) infections (either tubewell type) for the monsoon season in 2012 and 2013, under different scenarios used to assign the fraction of parasites infectious-to-humans (HUM = H: orange, MST = M: green, ENV = E: blue). Combined DTW & STW results are for an average child in a tubewell using household, accounting for rates of deep (48%) and shallow (52%) tubewell usage in the study population. Boiling rates (9% and 16% for deep and shallow tubewell users respectively) are accounted for in all results. Different vertical scales for 2012 and 2013 plots highlight the upper limits of burden between years.

