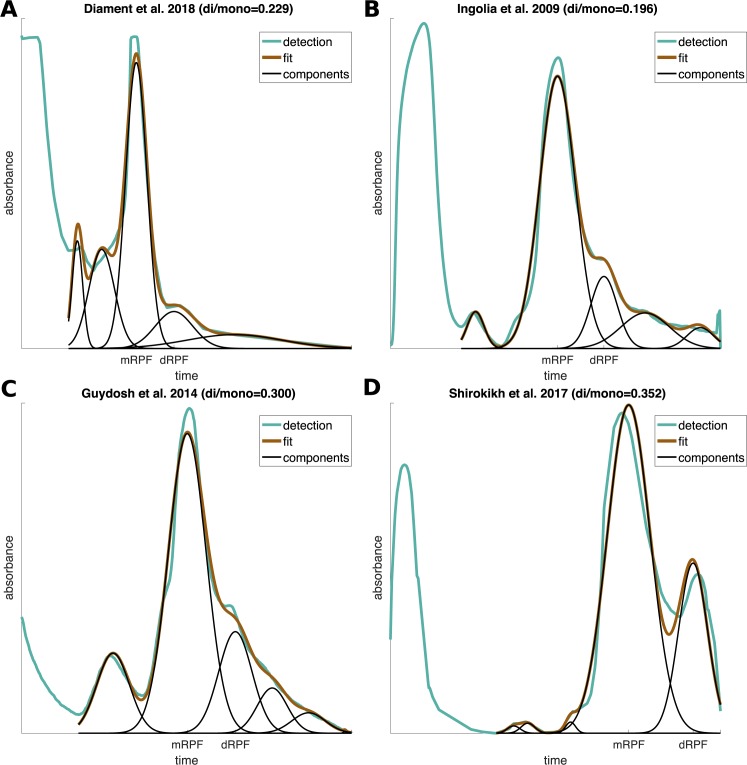
Fig 1. Sucrose gradient fractions.
(A) Quantification of ribosome protected footprints (RPFs) according to size. The plot shows the estimated components underlying the observed distribution, by means of Gaussian mixture. Each component reflects a set of footprints with a typical size, originating from a single ribosome (mono-RPF, mRPF), a pair of ribosomes (di-RPF, dRPF), etc. The ratio of dRPFs to mRPFs is reported in the caption. (B) Same for Ingolia 2009 data, profile reproduced from [23]. (C) Same for Guydosh 2014 data, profile reproduced from [33] (Fig 1 in the original paper). (D) Same for Shirokikh 2017 data, profile reproduced from [35] (Figure 5 in the original paper). See also S1 Fig.

