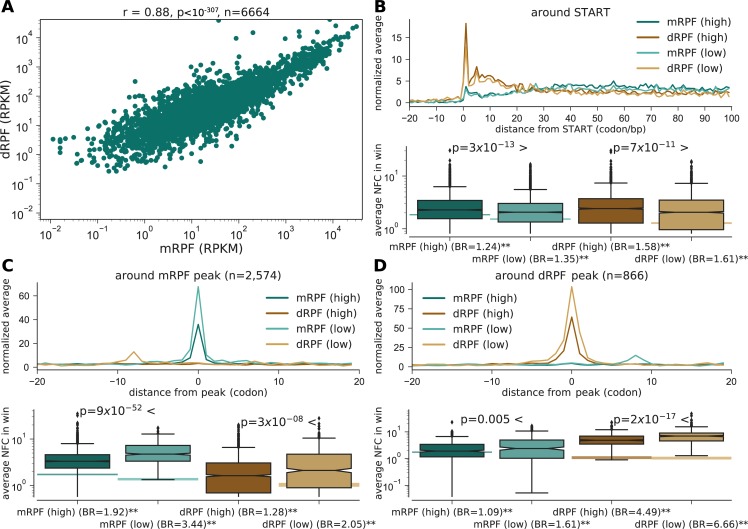
Fig 2. Ribosome profiling.
(A) mRPFs vs. dRPFs, RPKM values for each gene. Spearman’s rho and an asymptotic p-value are reported in the caption. (B) Top: Meta-gene analysis around the beginning of the ORF for mRPFs and dRPFs, plotted for highly and lowly expressed genes. Read counts were normalized per gene according to gene average (NFC), and the average across genes per position is shown. Bottom: The distribution for all genes of the mean NFC across the window in the top panel. P-values according to rank-sum test compare highly and lowly expressed genes. The background bands show the resulting medians when sampling random positions across the same genes (95% of the sampled medians fall within this range). Background ratio (BR) of the observed median vs. null is reported below (** denotes empirical p-value < 0.01). (C) Same, around peaks detected in mRPF profiles. (D) Same, around peaks detected in dRPF profiles. See also S2 Fig, S3 Fig.

