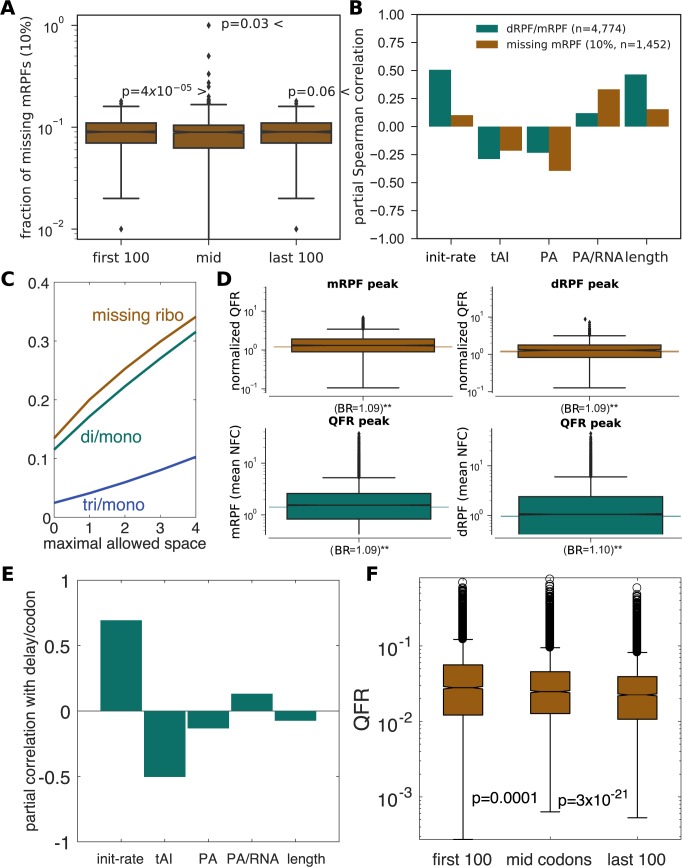
Fig 3. Queue analyses.
(A) Fraction of positions with detected missing mRPFs in genes, divded into 3 regions: first 100 codons, last 100 codons and the rest of the gene. mRPF profiles were downsampled to have the same number of reads as the dRPF profiles. Rank-sum p-values reported. (B) Partial Spearman correlations between the dRPF-to-mRPF ratio per gene, and the fraction of missing mRPFs (across the entire ORF) vs. various features (initiation rate, tRNA adaptation index, protein abundance–PA, PA per RNA copy and ORF length), while controlling for their dependencies. mRPF profiles were downsampled to have the same number of reads as the dRPF profiles. n indicates the number of genes, and the threshold for missing mRPF detection is indicated in percentage. See also S4 Fig. (C) The ratio between simulated dRPFs and mRPFs, as well as the estimated fraction of missing ribosomes when sequencing mRPFs, for different values of the maximal allowed space between ribosomes on a footprint (see also S4 Fig). (D) Top: Enriched simulated queued ribosomes in windows surrounding measured mRPF and dRPF peaks (empirical p-value < 0.01). Y-axis shows the average QFR (normalized similarly to NFC). Bottom: Enriched mRPFs and dRPFs in windows surrounding peaks in simulated profiled of the fraction of queued ribosomes per position (empirical p-value < 0.01). (E) Partial Spearman correlations between ribosome delay per codon of a gene, and various features while controling for their dependencies. (F) Distribution of the queued fraction of ribosomes (QFR) in 3 regions of the gene. Sign-rank p-value between box-plots.

