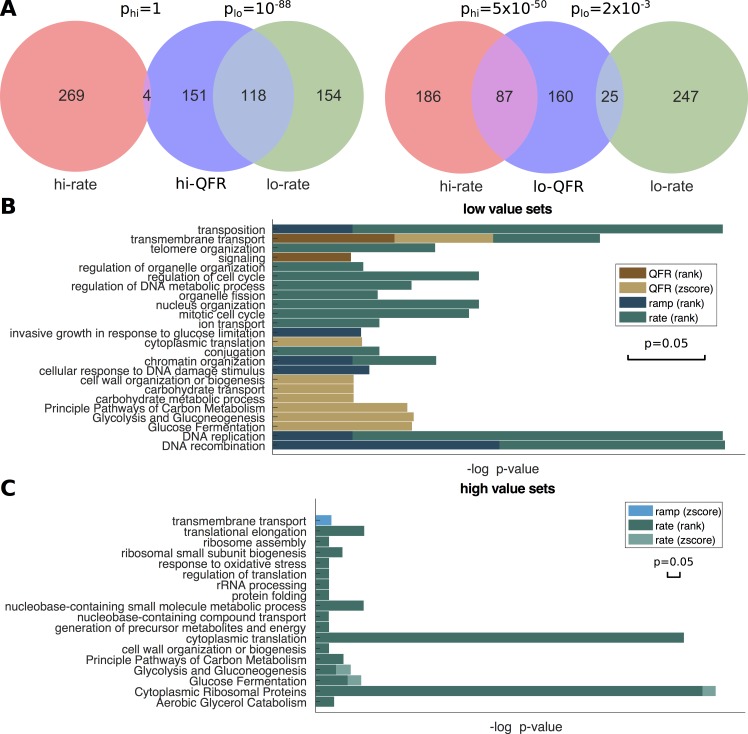
Fig 4. Functional enrichment.
(A) Sets of genes with extreme properties relative to randomizations of their synonymous codon order. Left: Intersection between the set of genes with the highest QFR compared to random, and genes with the highest/lowest translation rate compared to random. Right: The same for the lowest QFR compared to random. (B)-(C) Functional enrichment in different gene sets with extreme properties, according to their rank among genes, or according to their z-scores vs. codon randomizations. Each of the stacked bars represents the enrichment p-value of the corresponding term (longer bars for smaller p-values) in the gene set (denoted by color, see legend). The ramp score was defined by the ratio of QFR in the first 100 codons and the middle of the gene (excluding the first/last 100 codons). The scale of the 0.05-threshold is shown below the legend.

