
Figure 7. Radiation dose-dependent hippocampal atrophy.
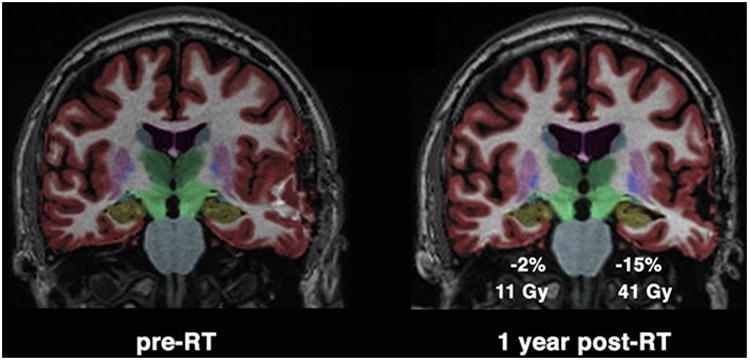
Coronal projection of brain MRI from a glioma patient pre-radiotherapy (pre-RT) on left, and one year post-radiotherapy (post-RT) on right. Color overlay shows automated segmentation of hippocampus in yellow. Greater percent decrease in hippocampal volume was seen in the hippocampus with higher mean dose of 41 Gy. 137