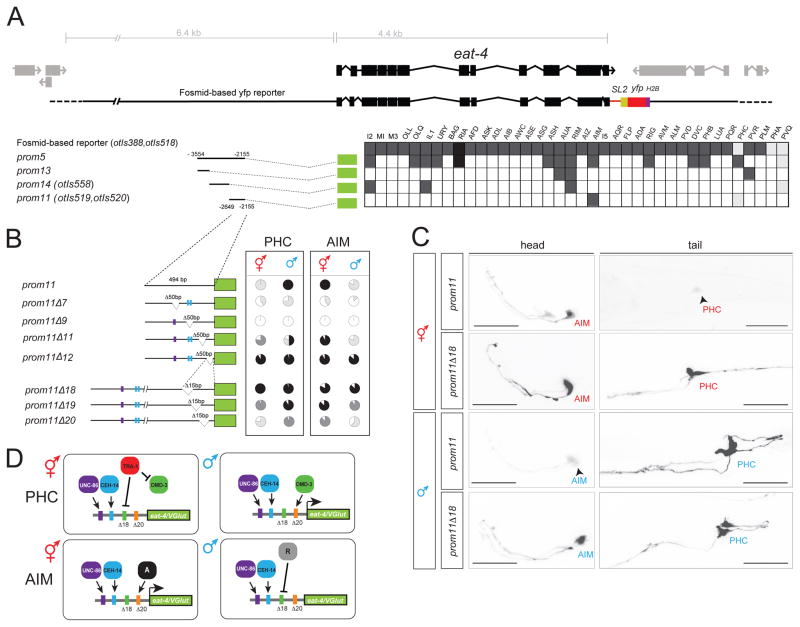
Fig. 5. Analysis of the cis-regulatory control elements of the eat-4 locus.
A: Dissection of the eat-4prom5 promoter. In the analysis of expression between two and three lines (n > 10) were scored for expression. The different shades of gray indicate the relative fluorescence intensity.
B: Deletion analysis of the eat-4prom11 promoter. The pie charts indicate the percentage of neurons that express the array with the four different shades denoting the overall fluorescence intensity in AIM and PHC in both sexes (white: no expression; black: strongest expression observed in any construct; light and dark grey: intermediate levels that are clearly distinct from each other and from maximum or no expression). At least two lines were analyzed for each deletion construct. Color bars in the promoters refer to putative homeodomain binding sites: blue bar indicates the CEH-14 binding site according to the ModEncode consortium; purple bar indicates the putative UNC-86 binding site. See Methods for sequences. See Fig. S1 for effect of CEH-14 and UNC-86 on eat-4 expression.
C: eat-4prom11 and eat-4prom11Δ18 reporter expression in the head and tail of young adults. Scale bar: 25 μm.
D: Summary schematic of eat-4/VGLUT regulatory logic. The same elements are required to achieve activator and repressor effects in the PHC and AIM neurons, but with opposite sexual specificity. In the AIM neurons, unknown factors “A” (for activator) and “R” (for repressor) may be different DMD transcription factors.

