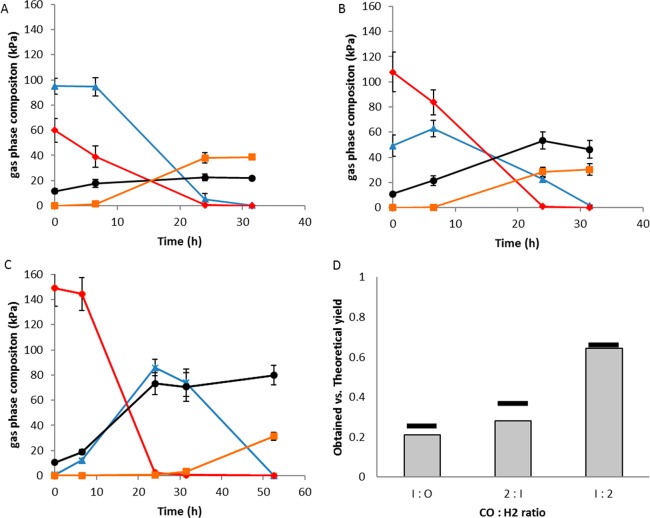
Figure 2.
Methanogenic coculture converting different headspace compositions to methane. (A) 1:2 CO:H2 mixture, (B) 2:1 CO:H2, (C) 1:0 CO:H2 mixture. Standard deviations are shown over triplicate bottle experiments. CO, red diamonds; H2, blue triangles; CO2, black circles; CH4, orange squares. (D). Methane yield per CO consumed under different initial CO:H2 compositions. Horizontal bars above the graphs display the theoretical yield based on initial gas content in the bottles.

