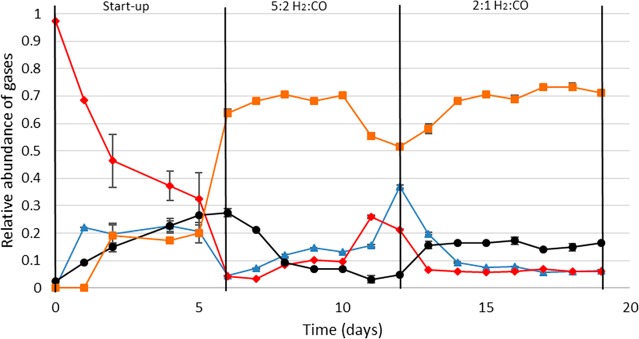
Figure 3.
Relative outflow gas composition of the coculture in a continuous bioreactor.
Relative gas composition in the reactor is shown. Total pressure in the system was 1 atm. Average values and standard deviations shown are calculated from triplicate measurements. Day 0–6: start-up phase in which CO and H2 flow and stirring were ramped up. Day 6–12: operation was performed with 2 mL/min CO and 5 mL/min H2. Day 12–19: operation was performed with 2 mL/min CO and 4 mL/min H2. CO, red diamonds; H2, blue triangles; CO2, black circles; CH4, orange squares.

