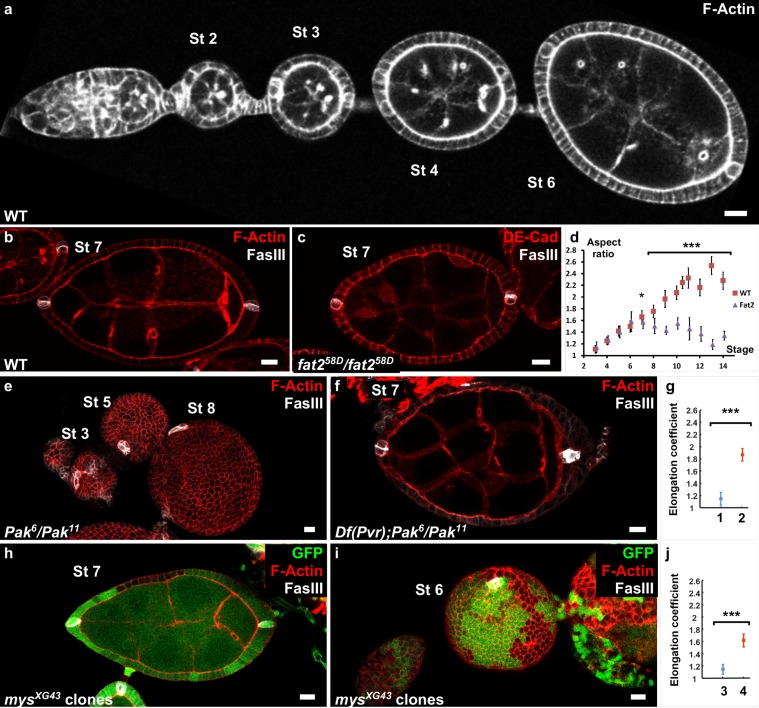
Figure 1. Polar cells determine the axis of early elongation.
(a) WT ovariole illustrating follicle elongation during the early stages of oogenesis (stages 2–6). (b) Optical cross-section of a stage 7 WT follicle stained with FasIII, a polar cell marker (white) and F-actin (red). (c) Stage seven fat2 mutant follicle stained with FasIII (white) and DE-Cad (red). (d) Elongation kinetics of WT and fat2 mutant follicles (n > 6 for each point). (e) Z-projection of a Pak mutant ovariole. Round follicles have only one cluster of polar cells (stage 5 and 8 follicles) or two non-diametrically opposed clusters (stage 3 follicle). (f) Removing a copy of Pvr restores early elongation and polar cell position in Pak mutants. (g) Elongation coefficient of Pak6/Pak11, Df(Pvr)/+ follicles, affecting (n = 23) (1) or not (n = 13) (2) polar cell positioning. (h,i) View of a mys mutant clone (GFP-negative) in a mosaic follicle showing (h) normal polar cell positioning and no elongation defect and (i) abnormal polar cell positioning and an early elongation defect. (j) Elongation coefficient of follicles containing mutant clones for mys affecting (n = 34) (3) polar cell positioning or not (n = 31) (4). Full details of the genotypes and sample sizes are given in the supplementary files. (p *<0.05, **<0.01, ***<0.001.) Scale bars are 10 μm throughout.


