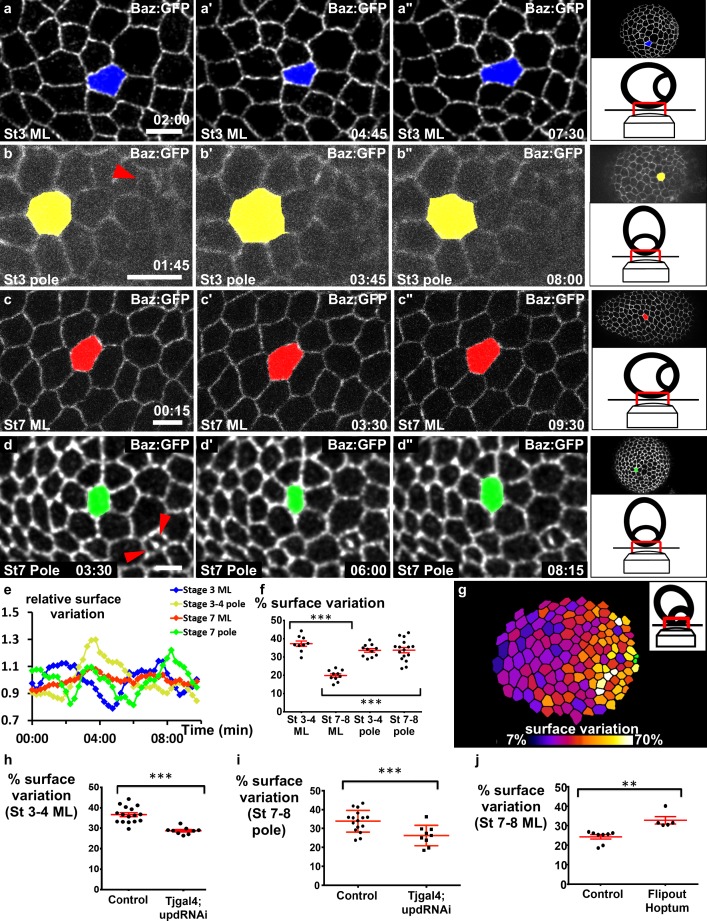
Figure 4. JAK-STAT induces a double gradient of pulses.
(a–d) Images from movies of the mediolateral region of (a) stage 3 and (c) stage 7 BAZ-GFP expressing follicles, or of the area near the polar cells (red arrowheads) of (b) stage 3 and (d) stage 7 follicles. Scale bars: 10 μm. (e) Surface variation of individual cells (examples shown in [a–d]) as a function of time (ML, mediolateral). The surface of each cell is divided by its average surface over time. (f) Mean percentage of apical surface variation depending on stage and position (n ≥ 9 follicles). (g) Color-coding of the pulse intensity of a representative stage 7 follicle (tilted view from the pole, see schematic image in insert) reveals an intensity gradient from the polar cells (in green) to the mediolateral region. (h–j) Mean percentage of apical surface variation in the mediolateral region of (h) stage 3–5 follicles and (j) stage 7 to 8 follicles, and (i) at the pole of stage 7–8 follicles for the indicated genotypes. (h, i) n ≥ 9, (j) n ≥ 5. (p **<0.01, ***<0.001, red bars represent mean and ± SD). Full details of the genotypes and sample sizes are given in the supplementary files.


