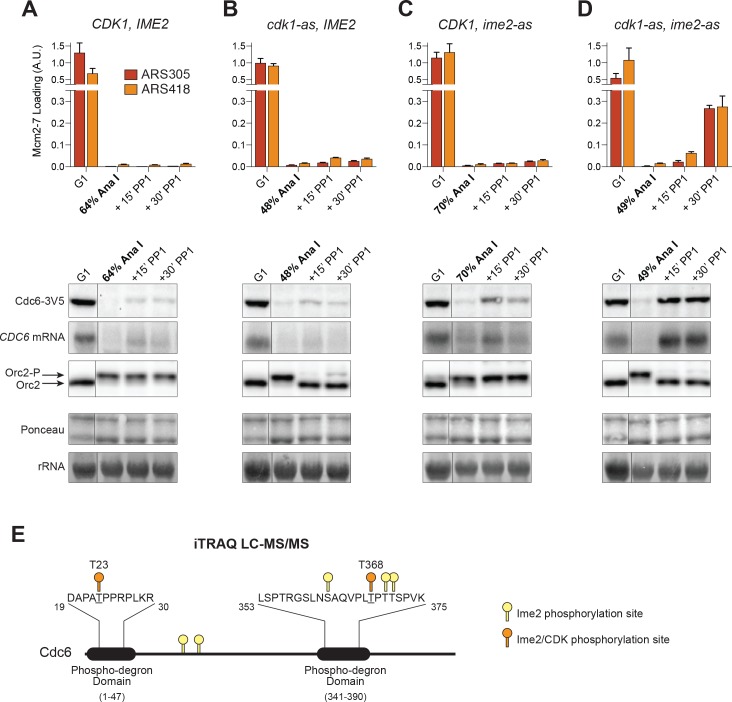
Figure 5. CDK and Ime2 cooperate to prevent Mcm2–7 loading and inhibit CDC6 expression during the MI–MII transition.
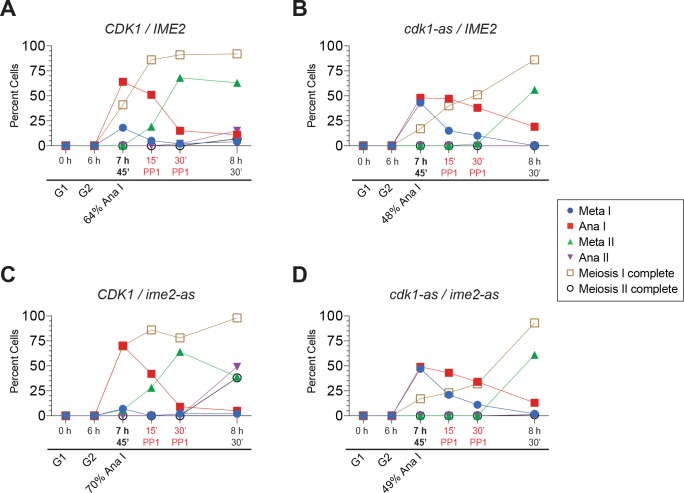
Simultaneous inhibition of both CDK and Ime2 is required for robust Mcm2–7 reloading and CDC6 reaccumulation during the MI-MII transition. (A–D): Mcm2–7 loading (ChIP-qPCR), Orc2 phosphorylation (immunoblots), and CDC6 protein and mRNA expression (immunoblots and northern blots) were analyzed in G1 phase as well as at the MI–MII transition. At the MI–MII transition, 10 µM 1–NM–PP1 and 20 µM 1–NA–PP1 were added. Samples were harvested 15 and 30 min after inhibitor addition. (A) Strain yDP71: CDK1, IME2. (B) Strain yDP152: cdk1–as, IME2. (C) Strain yDP176: CDK1, ime2–as. (D) Strain yDP177: cdk1–as, ime2–as. For cell–cycle stage quantification for Figure 5A–5D, see Figure 5—figure supplement 1A–1D, respectively. Mcm2–7 loading was analyzed at ARS305 (red) and ARS418 (orange). The peak % of input DNA immunoprecipitated (set to A.U. = 1.0) was 15.5% for ARS305 and 5.3% for ARS418. (E) Ime2 directly phosphorylates Cdc6 phospho–degron domains. Purified Cdc6 was treated with purified Ime2 or buffer–control in the presence of ATP. Quantitative mass spectroscopy was used to identify Ime2-dependent phosphorylation sites on Cdc6. Phosphorylation sites detected (with >4–fold enrichment upon Ime2 treatment) as well as the location of the Cdc6 phospho–degron domains are illustrated. Yellow markers indicate unique Ime2 sites. Orange markers indicate Ime2 sites that are also CDK sites based on previous work (Calzada et al., 2000; Drury et al., 2000). Phospho-degron domains are based on previous work (Perkins et al., 2001). For phosphorylation–site enrichment values, see Supplementary file 1.
Figure 5—figure supplement 1. Cells in Figure 5 entered the MI-MII transition at the time of kinase inhibition.
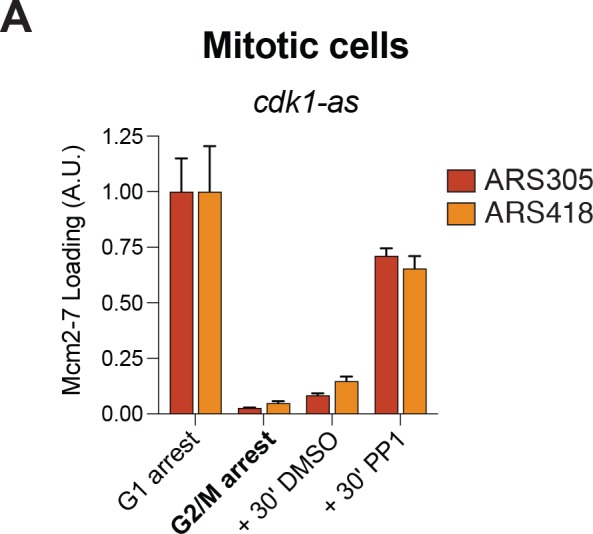
Figure 5—figure supplement 2. CDK inhibition using a cdk1–as allele is sufficient for Mcm2–7 reloading in mitotic cells.


