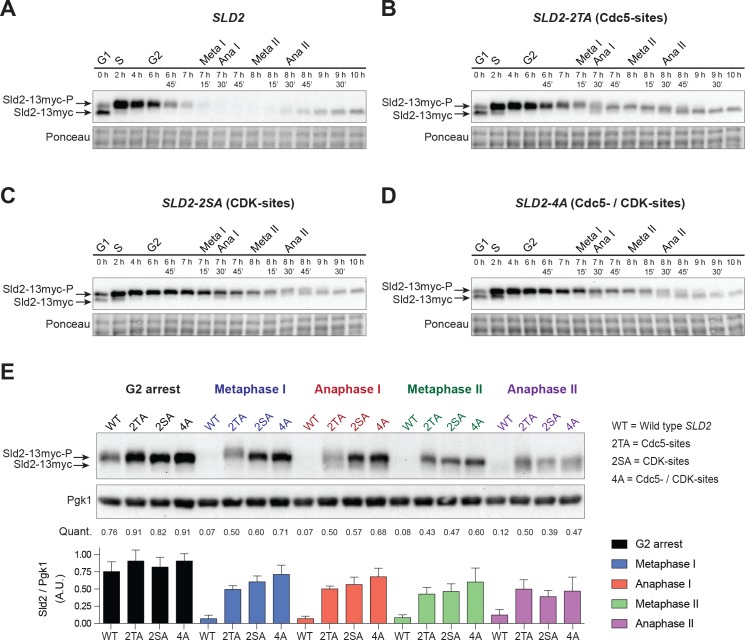
Figure 6. Sld2 is degraded during the meiotic divisions in a manner that depends on Cdc5- and CDK-phosphorylation sites.
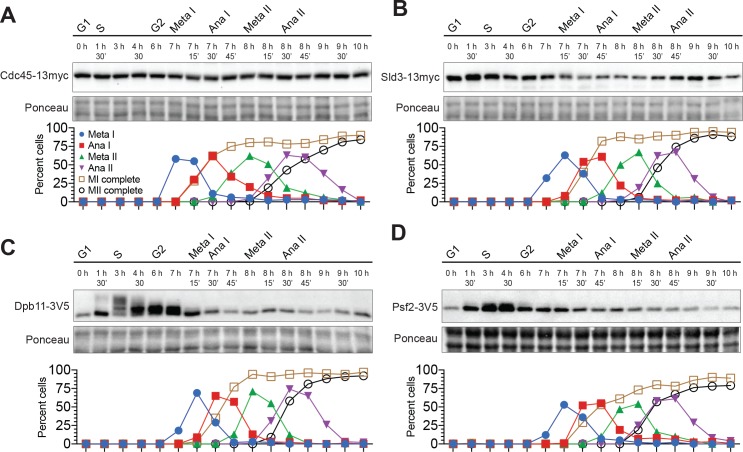
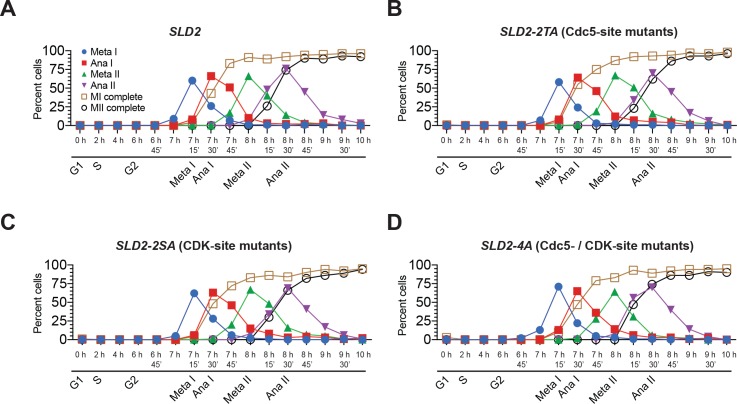
(A) Sld2 protein is degraded upon entry into the meiotic divisions. Immunoblots of Sld2–13myc during meiosis from strain yDP336. The time after transfer into sporulation medium and the associated meiotic stages are indicated above each lane. For cell–cycle synchrony, refer to Figure 6—figure supplement 2A. (B–D) Mutation of either Cdc5– or CDK–phosphorylation sites on Sld2 results in stabilization of Sld2 throughout the meiotic divisions: Immunoblots of Sld2–13myc during meiosis with the following mutations: (B) Cdc5–phosphorylation sites (strain yDP473: 2TA – T122A/T143A), (C) CDK–phosphorylation sites (strain yDP642: 2SA – S128A/S138A), or (D) Cdc5– and CDK–phosphorylation sites (strain yDP644: 4A – T123A/S128A/S138A/T143A). The time after transfer into sporulation medium and the associated meiotic stages are indicated above each lane. For cell–cycle synchrony, refer to Figure 6—figure supplement 2B–2D. (E) Top: Samples from (A–D) with the peak number of cells in G2, Metaphase I, Anaphase I, Metaphase II, and Anaphase II were run side–by–side. Middle: Mean of Sld2 levels normalized to PGK1 levels from three independent experiments. Bottom: Graph of Sld2/PGK1 quantification from three independent experiments. The mean is represented by the height of the bar. Error bars represent the standard deviation.


