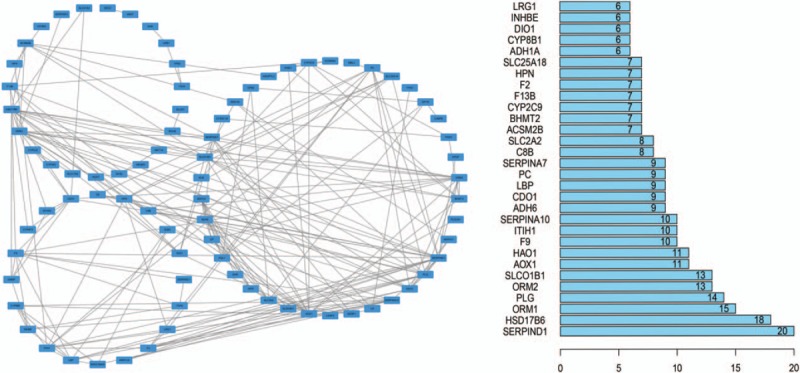
Figure 8.

The weighted genes coexpression network of downregulated DEGs (the blue module of WGCNA analysis). The left panel showed the coexpression interactions between the genes. The right panel showed the degree of the genes, only top 30 genes were listed out.
