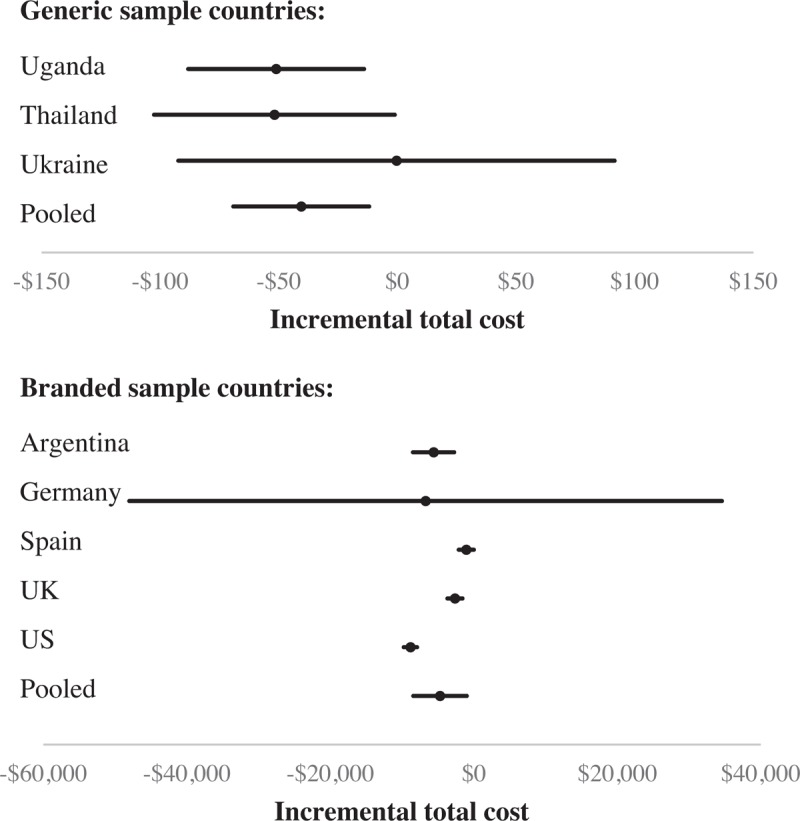
Figure 1.

Incremental total cost of SCT compared with continuous therapy. A forest plot for incremental total cost of SCT versus continuous therapy is shown by country based on raw imputed data. Mean incremental costs (95% confidence intervals) are denoted by black circles (black lines). The pooled results include the values of all the patients inside a sample (generic/branded). SCT = short-cycle therapy.
