Figure 3.

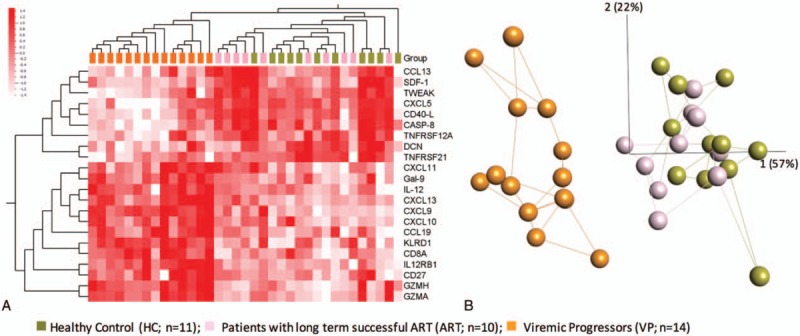
The plasma proteome profiles using hierarchical clustering. (A) Cluster analysis based on the soluble factors at FDR < 0.05. Heatmap shows fold change +1.5 (red) to −1.5 (white). (B) Cluster (k means) and network analysis with FDR < 0.001. FDR = false discovery rate.
