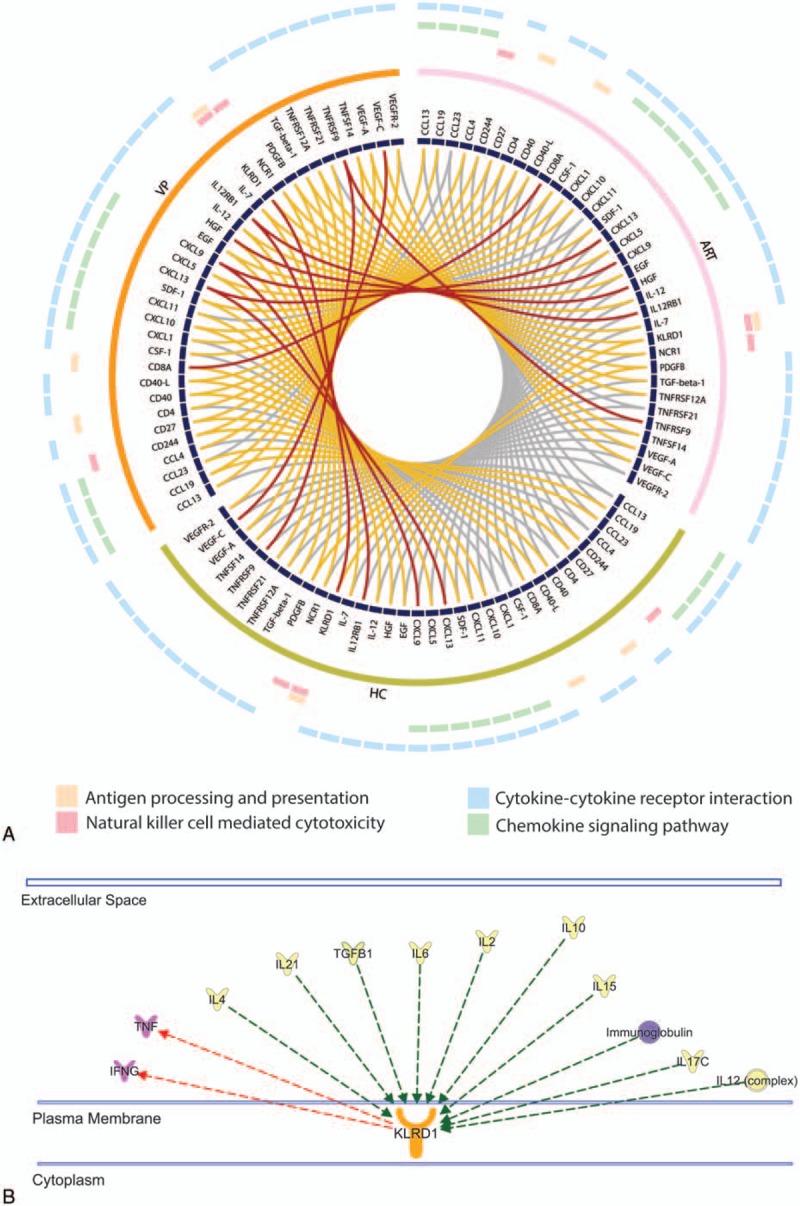
Figure 4.

Functional enrichment analysis. (A) CIRCOS plot is indicating the significance of soluble factors between 2 groups. Outer 4 circles denote the corresponding KEGG pathways. Each ribbon which links 2 proteins represent the comparison, and different colour indicates its P-value (Wilcoxon rank-sum test) in the analysis. Grey ≥.05, yellow: <.05 to 0.001, red: <.001. (B) Interactions of KLRD1 identified in Ingenuity Pathway Analysis (IPA). Selected extracellular molecules are shown. KLRD1 was regulated by proinflammatory molecules, IL15, IL21, IL2, IL4, IL12 complex, and so on (green arrow) and it regulates the TNF and cytokine signaling pathway (red arrow). KEGG = Kyoto Encyclopedia of Genes and Genomes, TNF = tumor necrosis factor.
