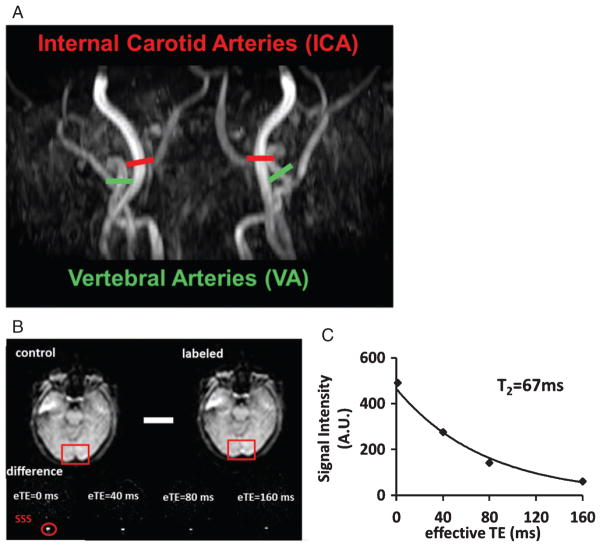
Fig. 1.
Representative MR images in one participant. A) Procedures to measurement of global CBF. Four PC MRI scans, red bars for Internal Carotid Arteries (ICA) and green bars for Vertebral Arteries (VA) are positioned perpendicular to the respective feeding arteries on an angiogram image (shown in black-and-white). B) Measurement of venous T2 value using T2 relaxation under spin tagging (TRUST) MRI. Upper panel shows raw images of control and labeled scans. The red boxes illustrate the manually drawn ROI of superior sagittal sinus (SSS). Lower panel shows difference images, i.e., control-labeled. eTE = effective echo time. Red circle highlighted the location of the SSS. C) Monoexponential fitting of the signal intensity in SSS as a function of eTE yields blood T2 value.

