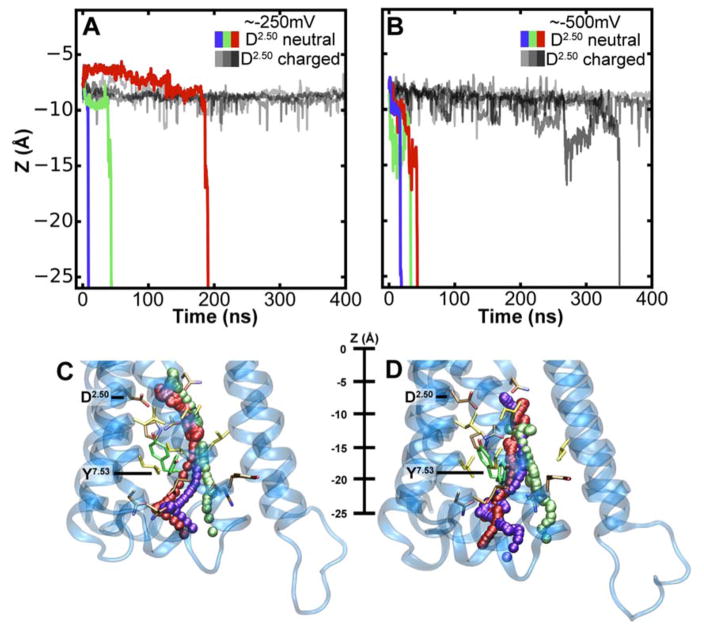
Figure 3. Migration of the Na+ ion across the receptor to the intracellular side.
(A–B) Z-coordinate of the Na+ ion in m2r under a hyperpolarised Vm of -250 mV (A) and -500 mV (B). Black and grey lines denote simulations with charged D692.50; purple, green and red lines display simulations with neutral D692.50. (C–D) Trajectories of the Na+ ion moving from the hydrophilic pocket, accessible from the extracellular space, into the intracellular bulk solution at -250 mV (C) and -500 mV (D). Three example trajectories are shown for each Vm; please see table S1 for a complete list. The color used to display the Na+ ion corresponds to the trajectories shown in panels A and B, respectively. Examples of the Y4407.53 upward and downward conformations are shown in green. The pathways of the ion toward the intracellular side are almost indistinguishable from each other until the ion passes Y4407.53. Thereafter, the pathways diverge to some degree due to the widened exit region to the cytoplasm.

