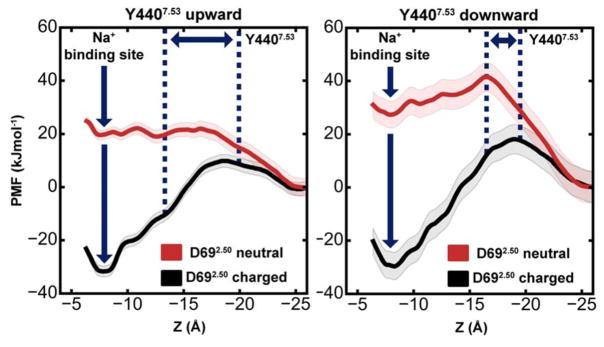
Figure 4. Energetics of Na+ translocation from the hydrophilic pocket to the intracellular side.
Equilibrium potential of mean force (PMF) profiles of the energetics of Na+ translocation along the Z-axis in m2r without any applied voltage or concentration gradients. Four relevant states were considered: (Left) negatively charged D692.50 (black) or neutral D692.50 (red) with the Y4407.53 sidechain in an upward conformation; (Right) negatively charged D692.50 (black) or neutral D692.50 (red) with a downward-oriented Y4407.53 sidechain. The standard deviation of the PMF, obtained from Bayesian bootstrap analysis, is depicted as shaded area. For each PMF, the intracellular bulk solution was used as a reference, and the range of positions adopted by the Y4407.53 sidechain is denoted by blue dotted lines.

