Figure 5.

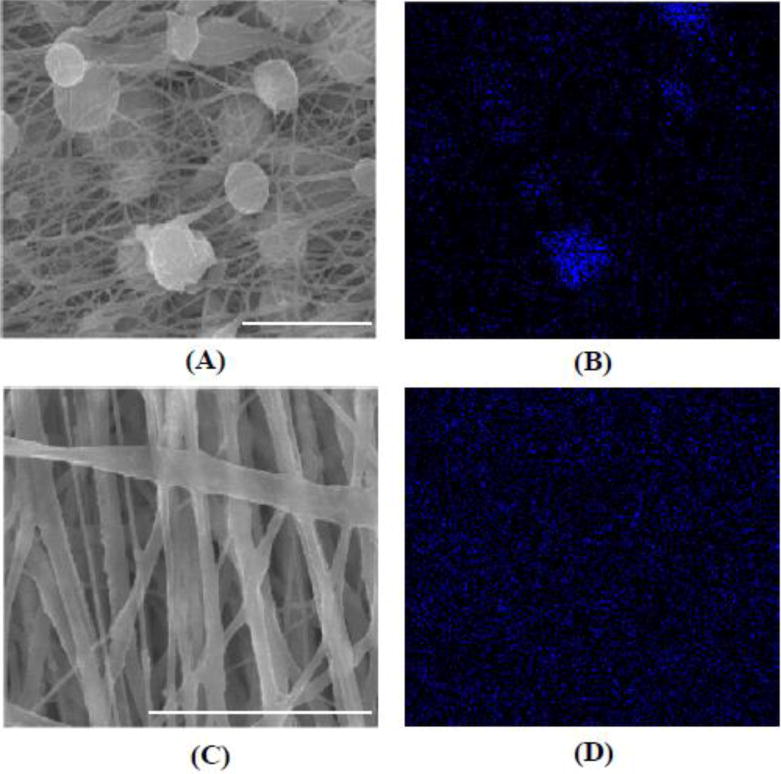
SEM images (A, C) and corresponding EDX analysis of Ti distribution in the scaffolds (B, D). (A, B) nTiO2/PEUU; (C, D) PEU-g–nTiO2/PEUU=2/1. Scale bar = 5 μm.

SEM images (A, C) and corresponding EDX analysis of Ti distribution in the scaffolds (B, D). (A, B) nTiO2/PEUU; (C, D) PEU-g–nTiO2/PEUU=2/1. Scale bar = 5 μm.