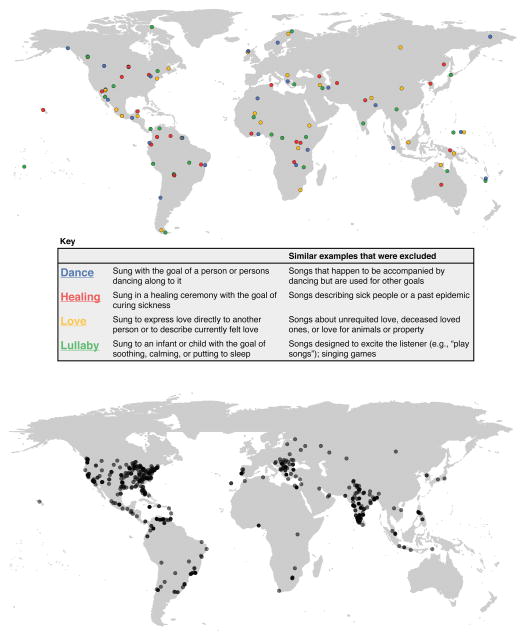
Figure 1. Locations of song recordings and listeners.
The 118 recordings were made in 86 societies, the locations of which are plotted in A, and sorted by song function (see Legend). Details on the societies and recordings are in Table 1 and in Method details. B, Locations of the listeners in Experiment 1 (n = 750), plotted with geolocation data gathered from IP addresses. Each gray dot represents a single listener; darker dots represent multiple listeners in the same region. Details on listener demographics and countries represented are in STAR Methods and Figure S1. See also Figure S1.

