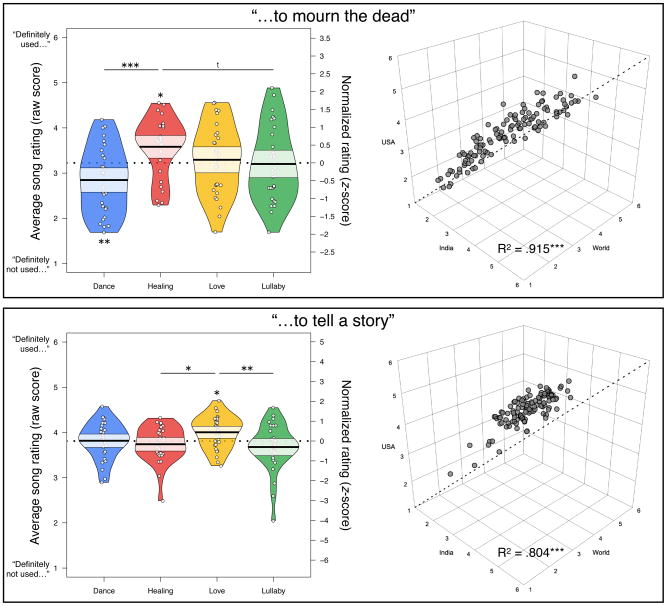
Figure 3. Exploratory findings from foil dimensions.
To mask the number of known song functions presented in the study, participants also rated the songs on two dimensions that were not explicitly represented by the songs in corpus. Thus, we had no predictions for responses on these dimensions. However, listener responses demonstrated modest, but consistent differences across song types. A, Healing songs are rated higher than average on “to mourn the dead”, and higher than both dance songs and lullabies, with B, consistent responses across cohorts. C, Despite the fact that listeners were unable to detect love songs on the dimension “to express love to another person” (see Figure 2), they did rate love songs higher than average on “to tell a story”, higher than healing songs and lullabies, and D, ratings across cohorts were highly consistent with one another. To explore the 3D plots directly, including rotation and zoom, please visit https://osf.io/xpbq2. Asterisks denote p-values from general linear hypothesis tests (left panels) or multiple regression omnibus tests (right panels). p < .001, **p < .01, *p < .05, tp < .1.

