
Figure 1. Direct B/T contact regulates naïve B cell survival.
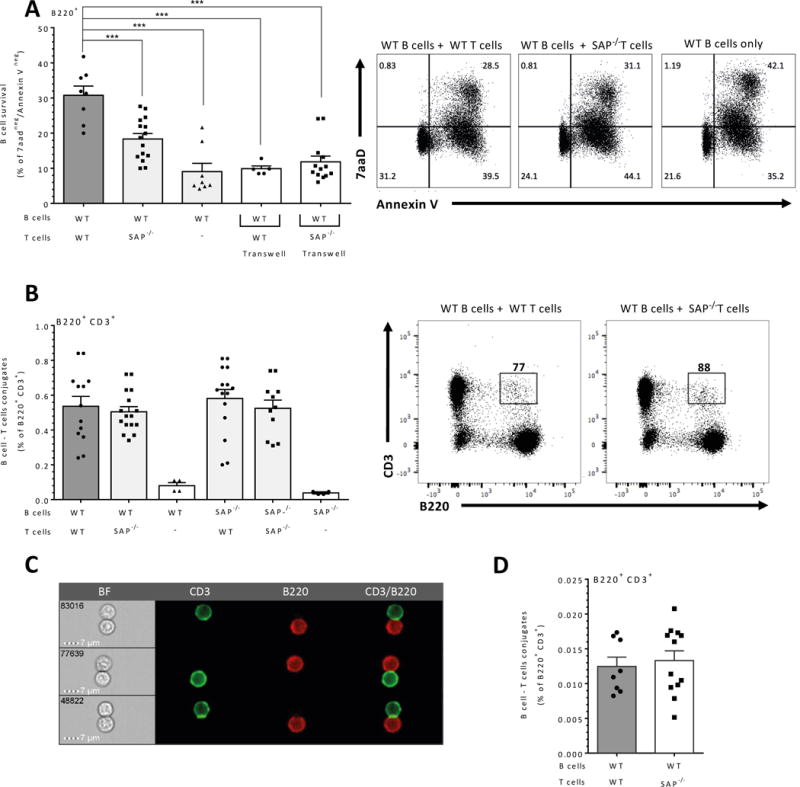
(A) Purified naïve wt B cells were cultured alone or at 1:1 ratio with 5×10⁶ wt or SAP−/− T cells in regular or Transwell apparatus wells (white bars). After 24 hrs, B cells were analyzed by flow cytometry for B cell survival by Annexin V/7AAD staining. Results are shown as the percentage of live B cells (double negative Annexin V/7AAD); right panels exhibit representative dot plots of Annexin V/7AAD staining. N=7 (B) Purified naïve wt or SAP−/− derived B cells were cultured alone or at a 1:1 ratio with 5×10⁶ wt or SAP−/− T cells. After 24 hrs, the cells were analyzed for T/B cell conjugates by flow cytometry of double positive staining for B220+ and CD3+. Results are shown as the percentage of conjugates. Right panels exhibit representative dot plots of B220/CD3 staining. N=4. (C–D) WT B cells were cultured together with WT or SAP−/− T cells. B/T cell conjugates were analyzed by imaging flow cytometry (Image Stream, n=6). (C) Representative images of wt B cells co-cultured with wt T cells. (D) Percentage of B/T doublets of total B and T cell populations. Results are shown as the percentage of T/B cell conjugates. N=4. Each dot represents a biological repeat, and bars show SEM. ns p≥ 0.05, * p<0.05, **p<0.01, ***p<0.001, ****p<0.0001