
Figure 2. SAP dependent B and T cell interactions regulate CD74 expression on the B cell surface.
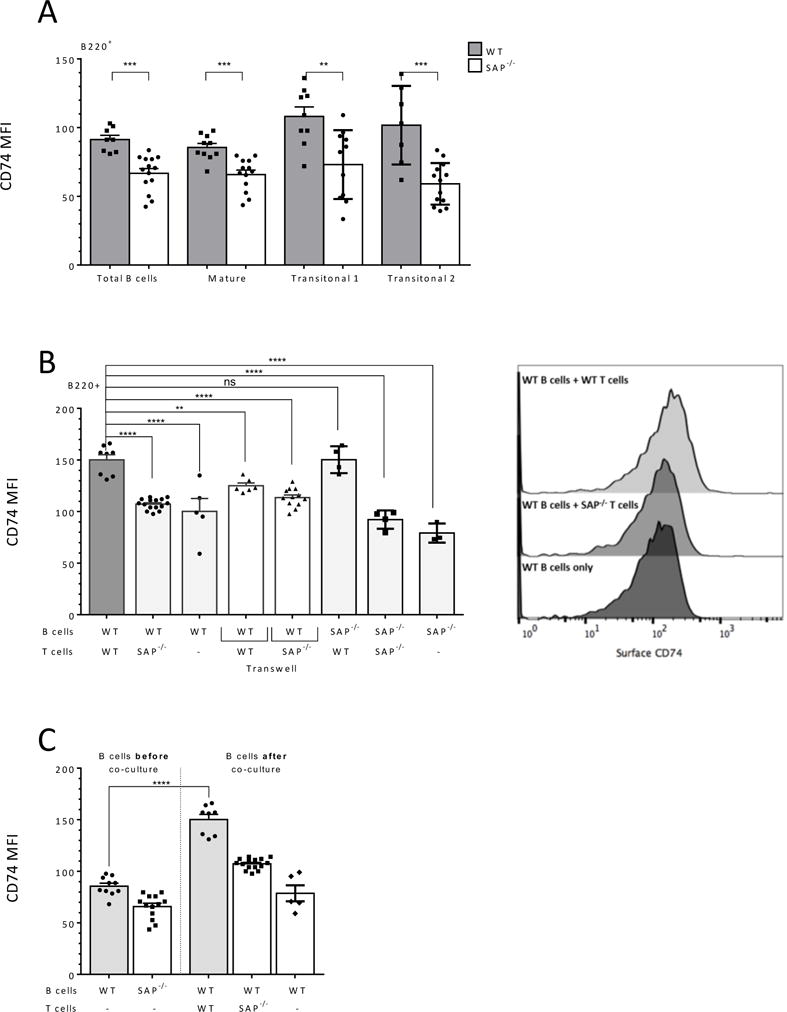
(A) Wt and SAP−/− splenocytes were analyzed by flow cytometry for surface CD74 expression on B cell populations. Total B cells (B220+); mature population (B220+, CD21intCD24low), Transitional 1 (B220+, CD21lowCD24high) and Transitional 2 (B220+, CD21highCD24+CD23+); graph show CD74 MFI levels. N=4. (B) Naïve wt and SAP−/− derived B cells and wt or SAP−/− T splenocytes were isolated. B cells were cultured alone or at a 1:1 ratio with 5×10⁶ wt or SAP−/− T cells in regular or Transwell apparatus wells. After 24 hrs, cells were analyzed by flow cytometry for CD74 surface expression on B cells. Graph shows CD74 MFI levels. Right panels exhibit representative histograms of CD74 staining on B220+ cells. N=4. (C) Purified wt or SAP−/− were cultured for 24 hours alone or at 1:1 ratio with 5×10⁶ wt or SAP−/− T cells were analyzed for CD74 surface expression before (“B cells before co-culture”) or after (“B cells after co-culture”) co-culture. CD74 MFI levels are shown in the graph. In all the graphs, each dot represents a biological repeat. N=3. Bars showing SEM. ns p≥ 0.05, * p<0.05, **p<0.01, ***p<0.001, ****p<0.0001