
Figure 3. SAP dependent B and T cell interaction regulates SLAMF6 expression and function in B cells.
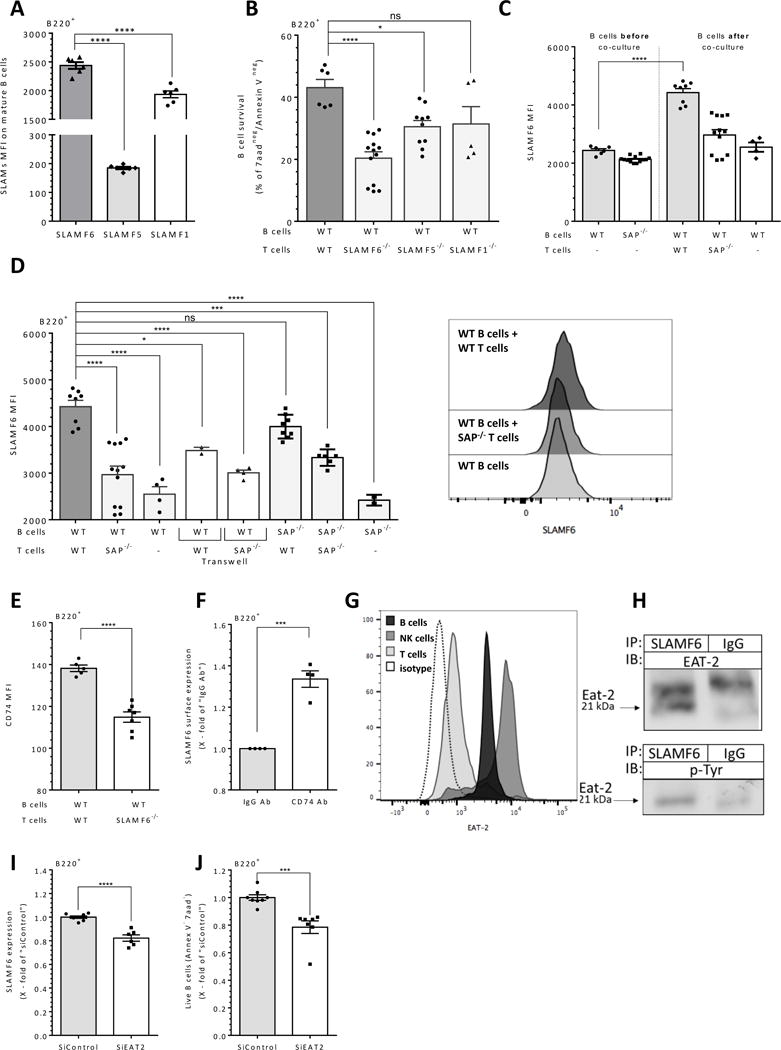
(A) Fresh wt mature naïve B cells were analyzed by flow cytometry for SLAMF6, SLAMF5 and SLAMF1 surface expression. Results are shown as the levels of SLAM receptor MFI. N=3. (B) Wt B cells were cultured at a 1:1 ratio with 5×10⁶ wt/SLAMF6−/−/SLAMF5−/−/or SLAMF1−/− T cells. After 24 hrs, B cells were analyzed by flow cytometry for B cell survival by Annexin V/7AAD staining. Results are shown as the percentage of live B cells (double negative for Annexin V/7AAD). N=6. _(C) Fresh wt or SAP−/− (“B cells before co-culture”) and purified naïve wt B cells were cultured for 24 hours alone at 1:1 ratio with 5×10⁶ wt or SAP−/− T cells (“B cells after co-culture”), were analyzed for SLAMF6 expression. SLAMF6 MFI levels are shown in the graph. N=3. (D) Naïve wt or SAP−/− derived B cells and wt or SAP−/− T splenocytes were cultured alone or at a 1:1 ratio with 5×10⁶ wt or SAP−/− T cells in regular or Transwell apparatus (white bars) wells. After 24 hrs, cells were analyzed by flow cytometry for SLAMF6 expression on B cells (B220+ gate). Results are shown as SLAMF6 MFI; right panels display representative histograms of SLAMF6 staining on B220+ cells. N=4. (E) Naïve wt B splenocytes were cultured alone or at a 1:1 ratio with 5×10⁶ wt or SLAMF6−/− T cells. After 24 hrs, cells were analyzed by flow cytometry for CD74 expression, shown by CD74 MFI. N=3 (F) Naïve mature wt B cells were activated with anti-CD74 or IgG control antibodies for 18 hrs. Cells were then analyzed for SLAMF6 expression on the B220+ gate. N=3 (G) Fresh B cells, NK cells and T cells were analyzed for EAT-2 expression by intra-cellular staining and flow cytometry analysis. Results are shown as representative histograms of EAT-2 expression on the various populations. (H) Purified wt B splenocytes were lysed, and SLAMF6 was immunoprecipitated. Proteins were separated by 12% SDS-PAGE and analyzed for EAT-2 expression (Top panel N=3), and for p-Tyr (G-bottom, N=2). (I-J) siRNA control or EAT2 treated naive B cells were were co-cultured with untreated naive T cells. After 48 hrs, the cells were stained for SLAMF6 (I) and annexin V and 7aad (J). N=2. In all graphs, each dot represents a biological repeat. N represents the number of experiments._Bars showing SEM. ns p≥ 0.05, * p<0.05, **p<0.01, ***p<0.001, ****p<0.0001