
Figure 7. The role of SLAMF6 in CD74 regulation on human B cells in vitro and in vivo.
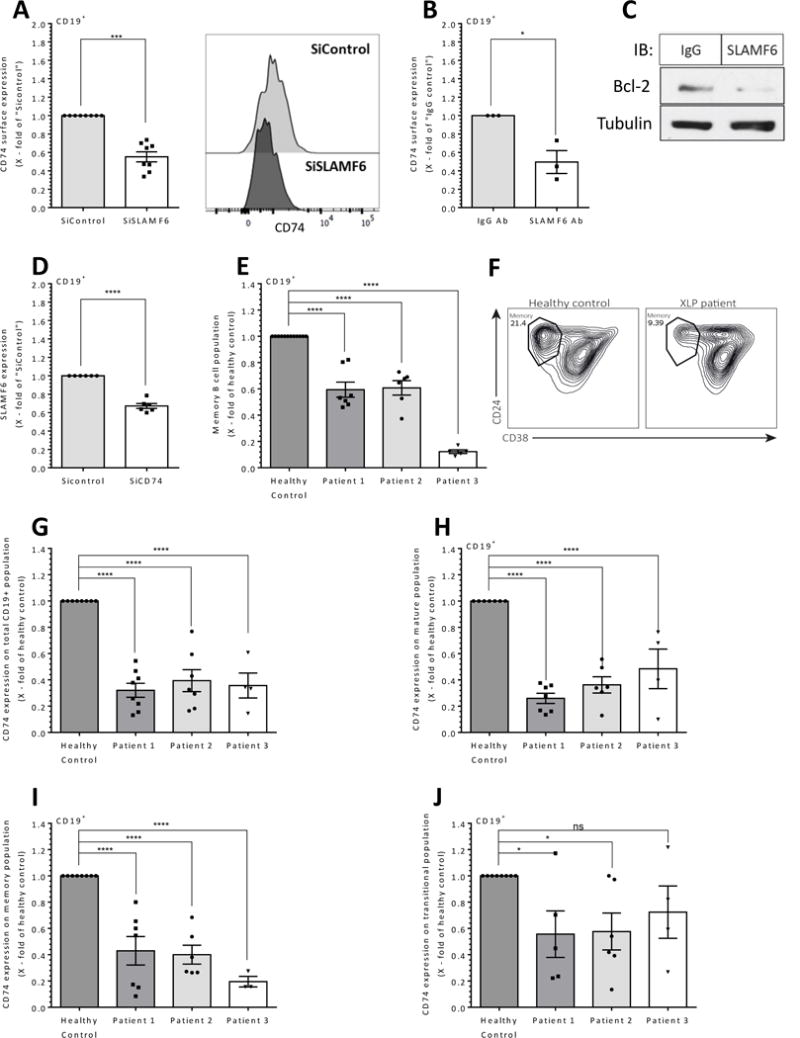
(A) Healthy human B cells were co-cultured with healthy human PB T cells which were treated with SLAMF6 or control siRNA. After 48 hrs, CD74 surface expression was analyzed by FACS. Right panel shows representative CD74 histograms. N=3 (B-C) Purified PB B and T cells were incubated in the presence of anti-SLAMF6 or control IgG antibodies. After 24 hrs, (B) CD74 surface expression was analyzed by flow cytometry (C) Purified B cells were lysed and analyzed for Bcl2 and tubulin by western blot analysis (N=3). (D) PB B cells were treated with control scrambled or CD74 siRNA and co-cultured with non-treated healthy PB T cells. After 48 hrs, the cells were analyzed by flow cytometry for SLAMF6. N=3. Results are shown as fold change relative to the si-control group; bars indicate SD. Each dot represents one sample. N represents the number of experiments.* p<0.05, ***p<0.001, ****p<0.0001
(E-F) Lymphocytes were isolated from PB derived from XLP and healthy patients and stained for B cell populations. Results are shown as fold change relative to the control group; bars indicate SD. Each repeat represents a different blood sample from the same patient. (E) Memory B cells (Patient 1, n=8; Patient 2, n=6; Patient 3, n=5). (F) Representative contour plots of B cell population in healthy control and in XLP patients. (G-J) CD74 expression was analyzed on B cell populations derived from subjects with XLP and compared to healthy controls. CD74 surface expression on the total CD19+ population (Patient 1, n=8; Patient 2, n=7; Patient 3, n=4) (G), mature B cell population (Patient 1, n=7; Patient 2, n=6; Patient 3, n=3) (H), memory B cell population (patient 1, n=7; Patient 2, n=6; Patient 3, n=3) (I), and transitional B cell population (Patient 1, n=5; Patient 2, n=6; Patient 3, n=3) (J). ns p> 0.05, * p<0.05, **p<0.01, ***p<0.001.